By 2050, nearly every building we’ll live or work in already exists today, about 85% of them. That means the future in construction is overwhelmingly maintaining and reimagining the structures around us. That statistic reshapes how we should think about the trades. Digging through U.S. government data [1], I found a few more insights that reveal just how complex the industry really is.
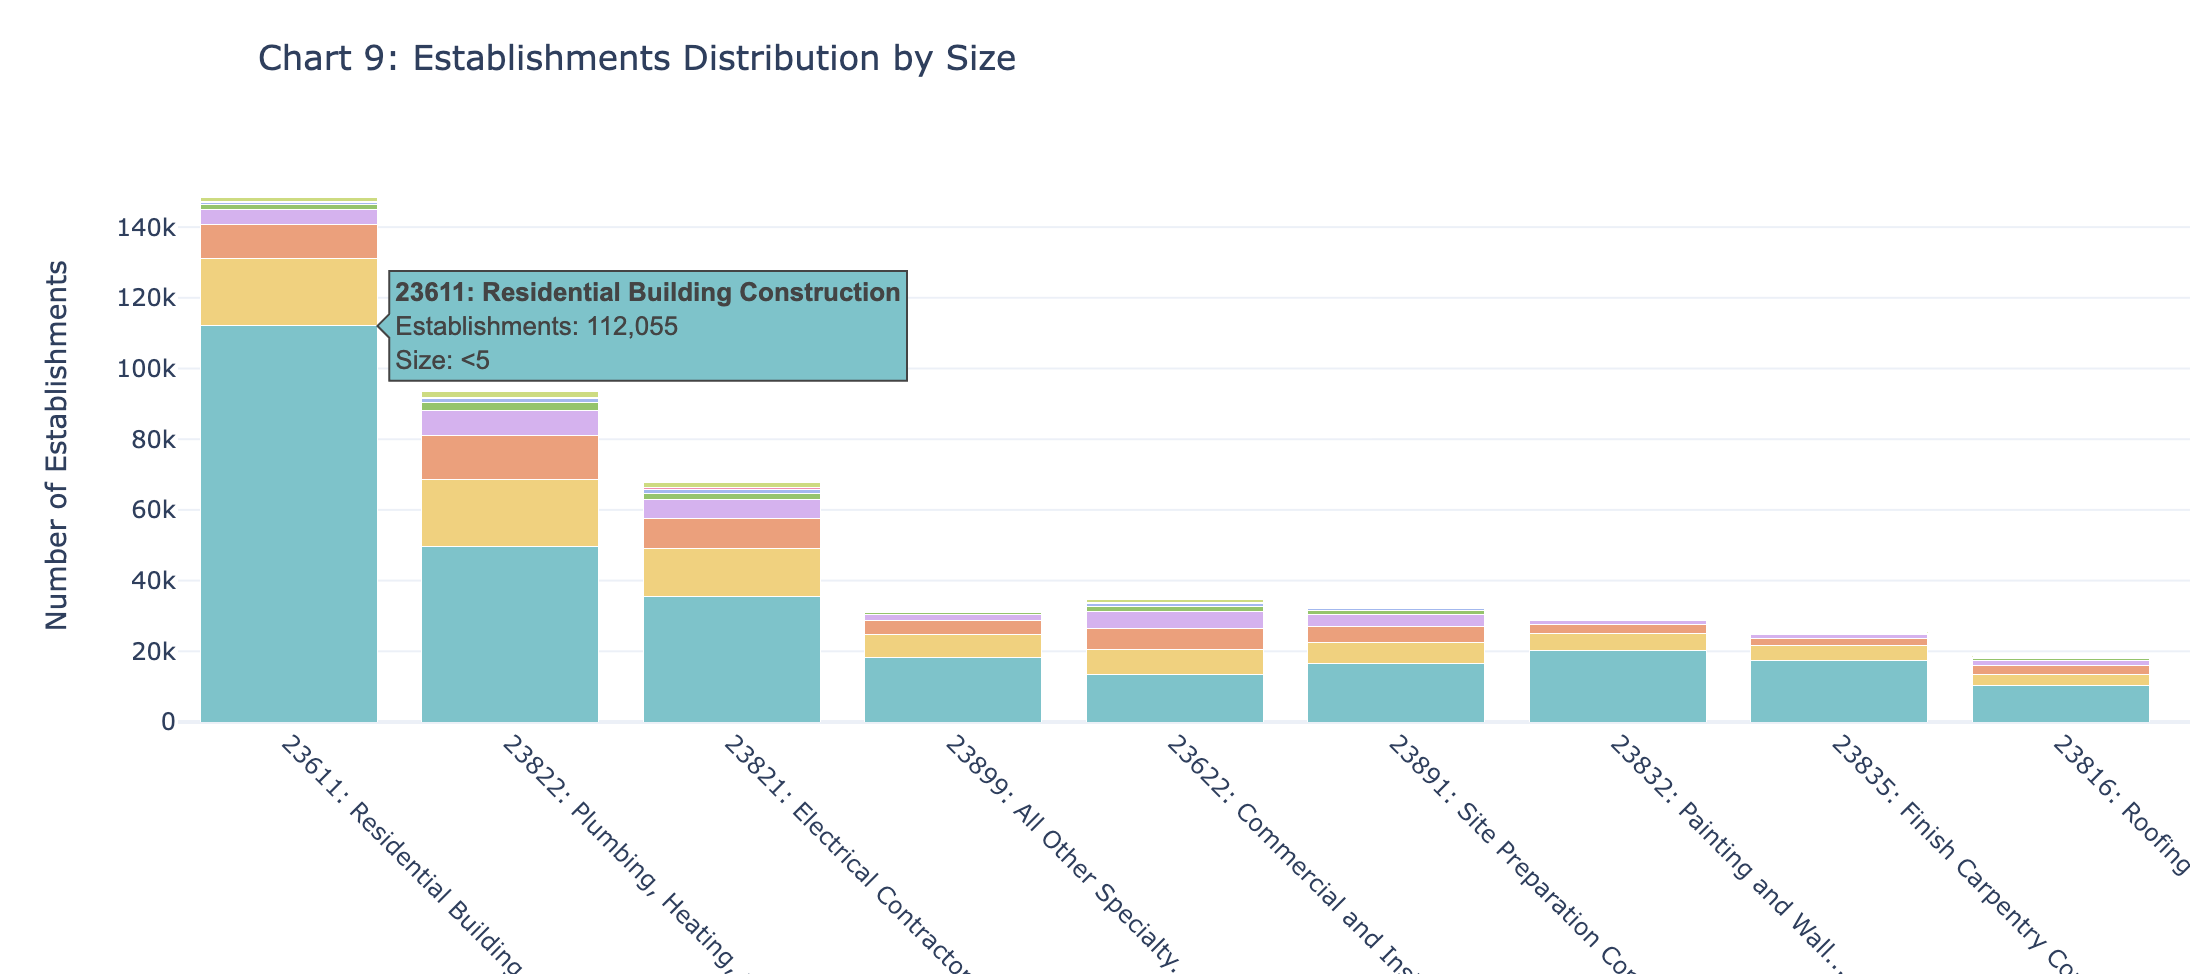
Construction is a world of specialists. While residential contractors have the most firms at over 200k, the real muscle is in MEP (mechanical, electrical and plumbing). Mechanical and Electrical contractors dominate not just in cumulative payroll spend, but also in sheer numbers, each employing 800k people. Double what most other individual trades employ. But the structure of these firms is what’s truly fascinating. In residential contractors, it’s a world of small operators. A staggering 54% of all firms have fewer than 5 employees. That’s the polar opposite of sectors like Oil & Gas where the dominant bucket of firms has 500+ employees. Fragmentation isn’t just about size but geography as well. Using “average” firm size doesn’t work. Take framing contractors: Arizona and Texas employ roughly the same number of people, but Texas has three times as many firms. It’s a complicated market.
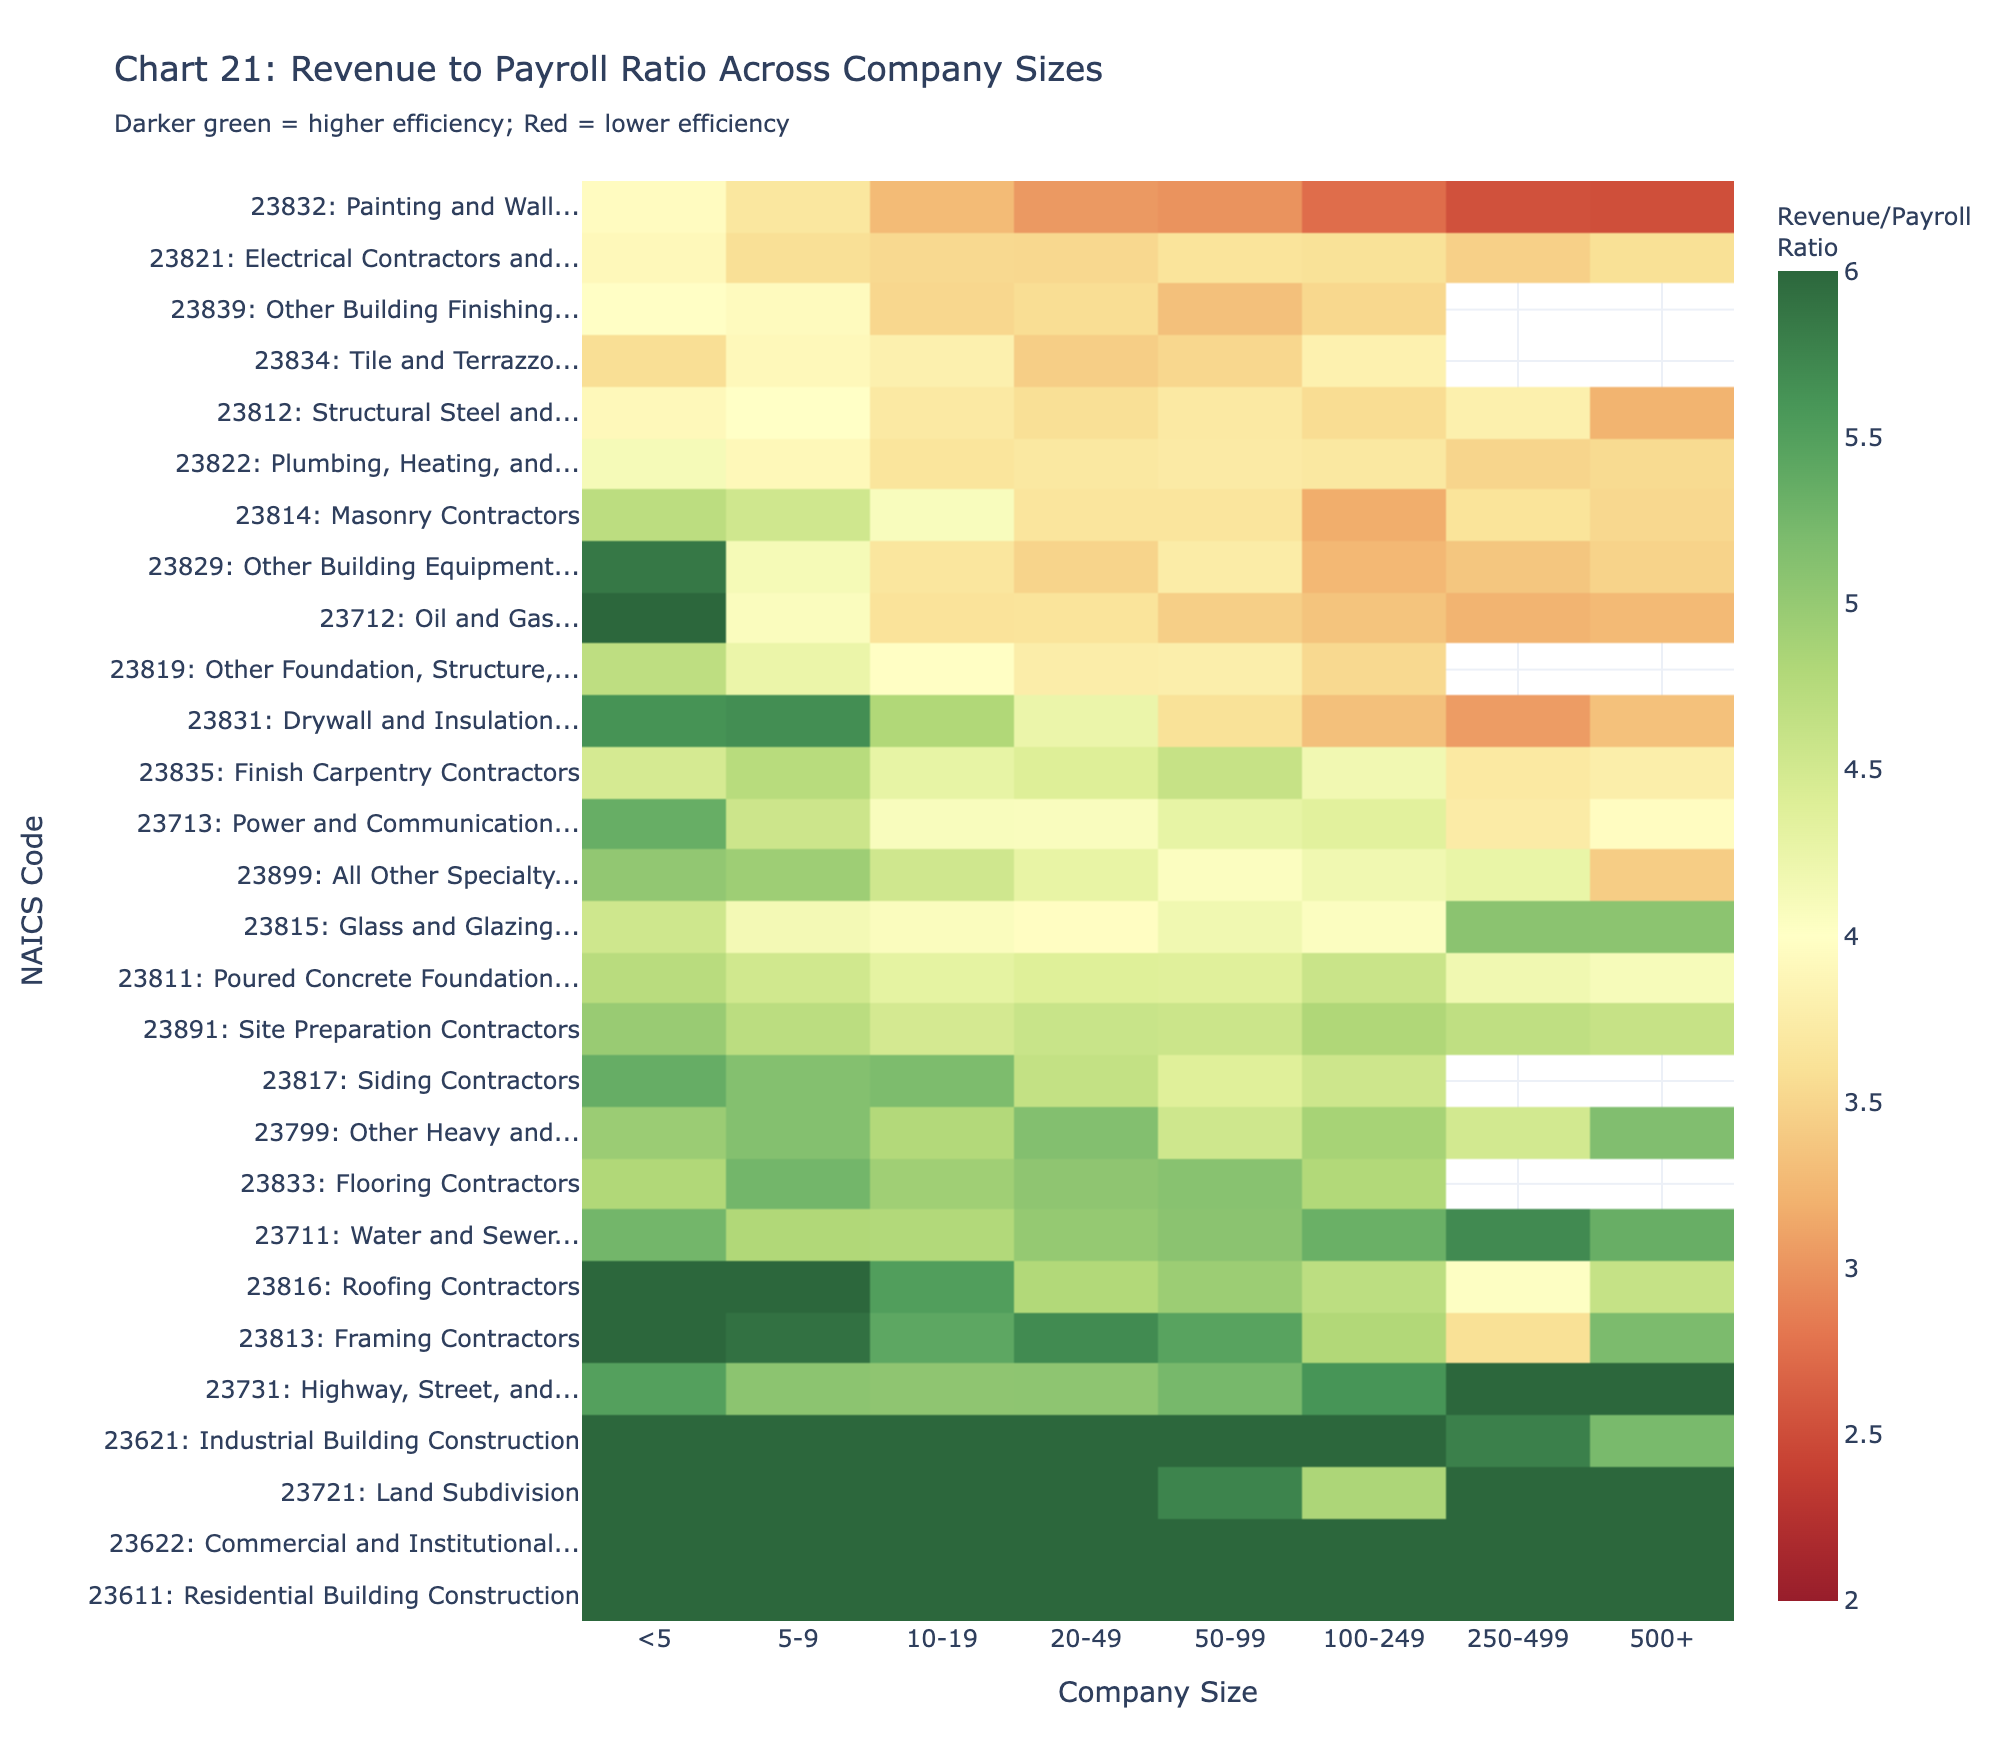
 Deriving insights from revenue is a little harder due to the sub contracting nature of construction. Highest revenue generating trades are commercial (general contractors) and residential, but these trades pay the other so the statistic is misleading. If you look at more specialized trades, there are differences, for example painting contractors generate $172k per employee while electrical is $257k. What I found most interesting was looking at the efficiency ratio, revenue generated for every dollar spent on payroll. Most trades hover between 3x and 5x ratio, but most interestingly the ratio gets worse as the company gets bigger. We intuitively expect bloat as firms scale, but the data proves it. The medium pay going up as the company scales also confirms this.
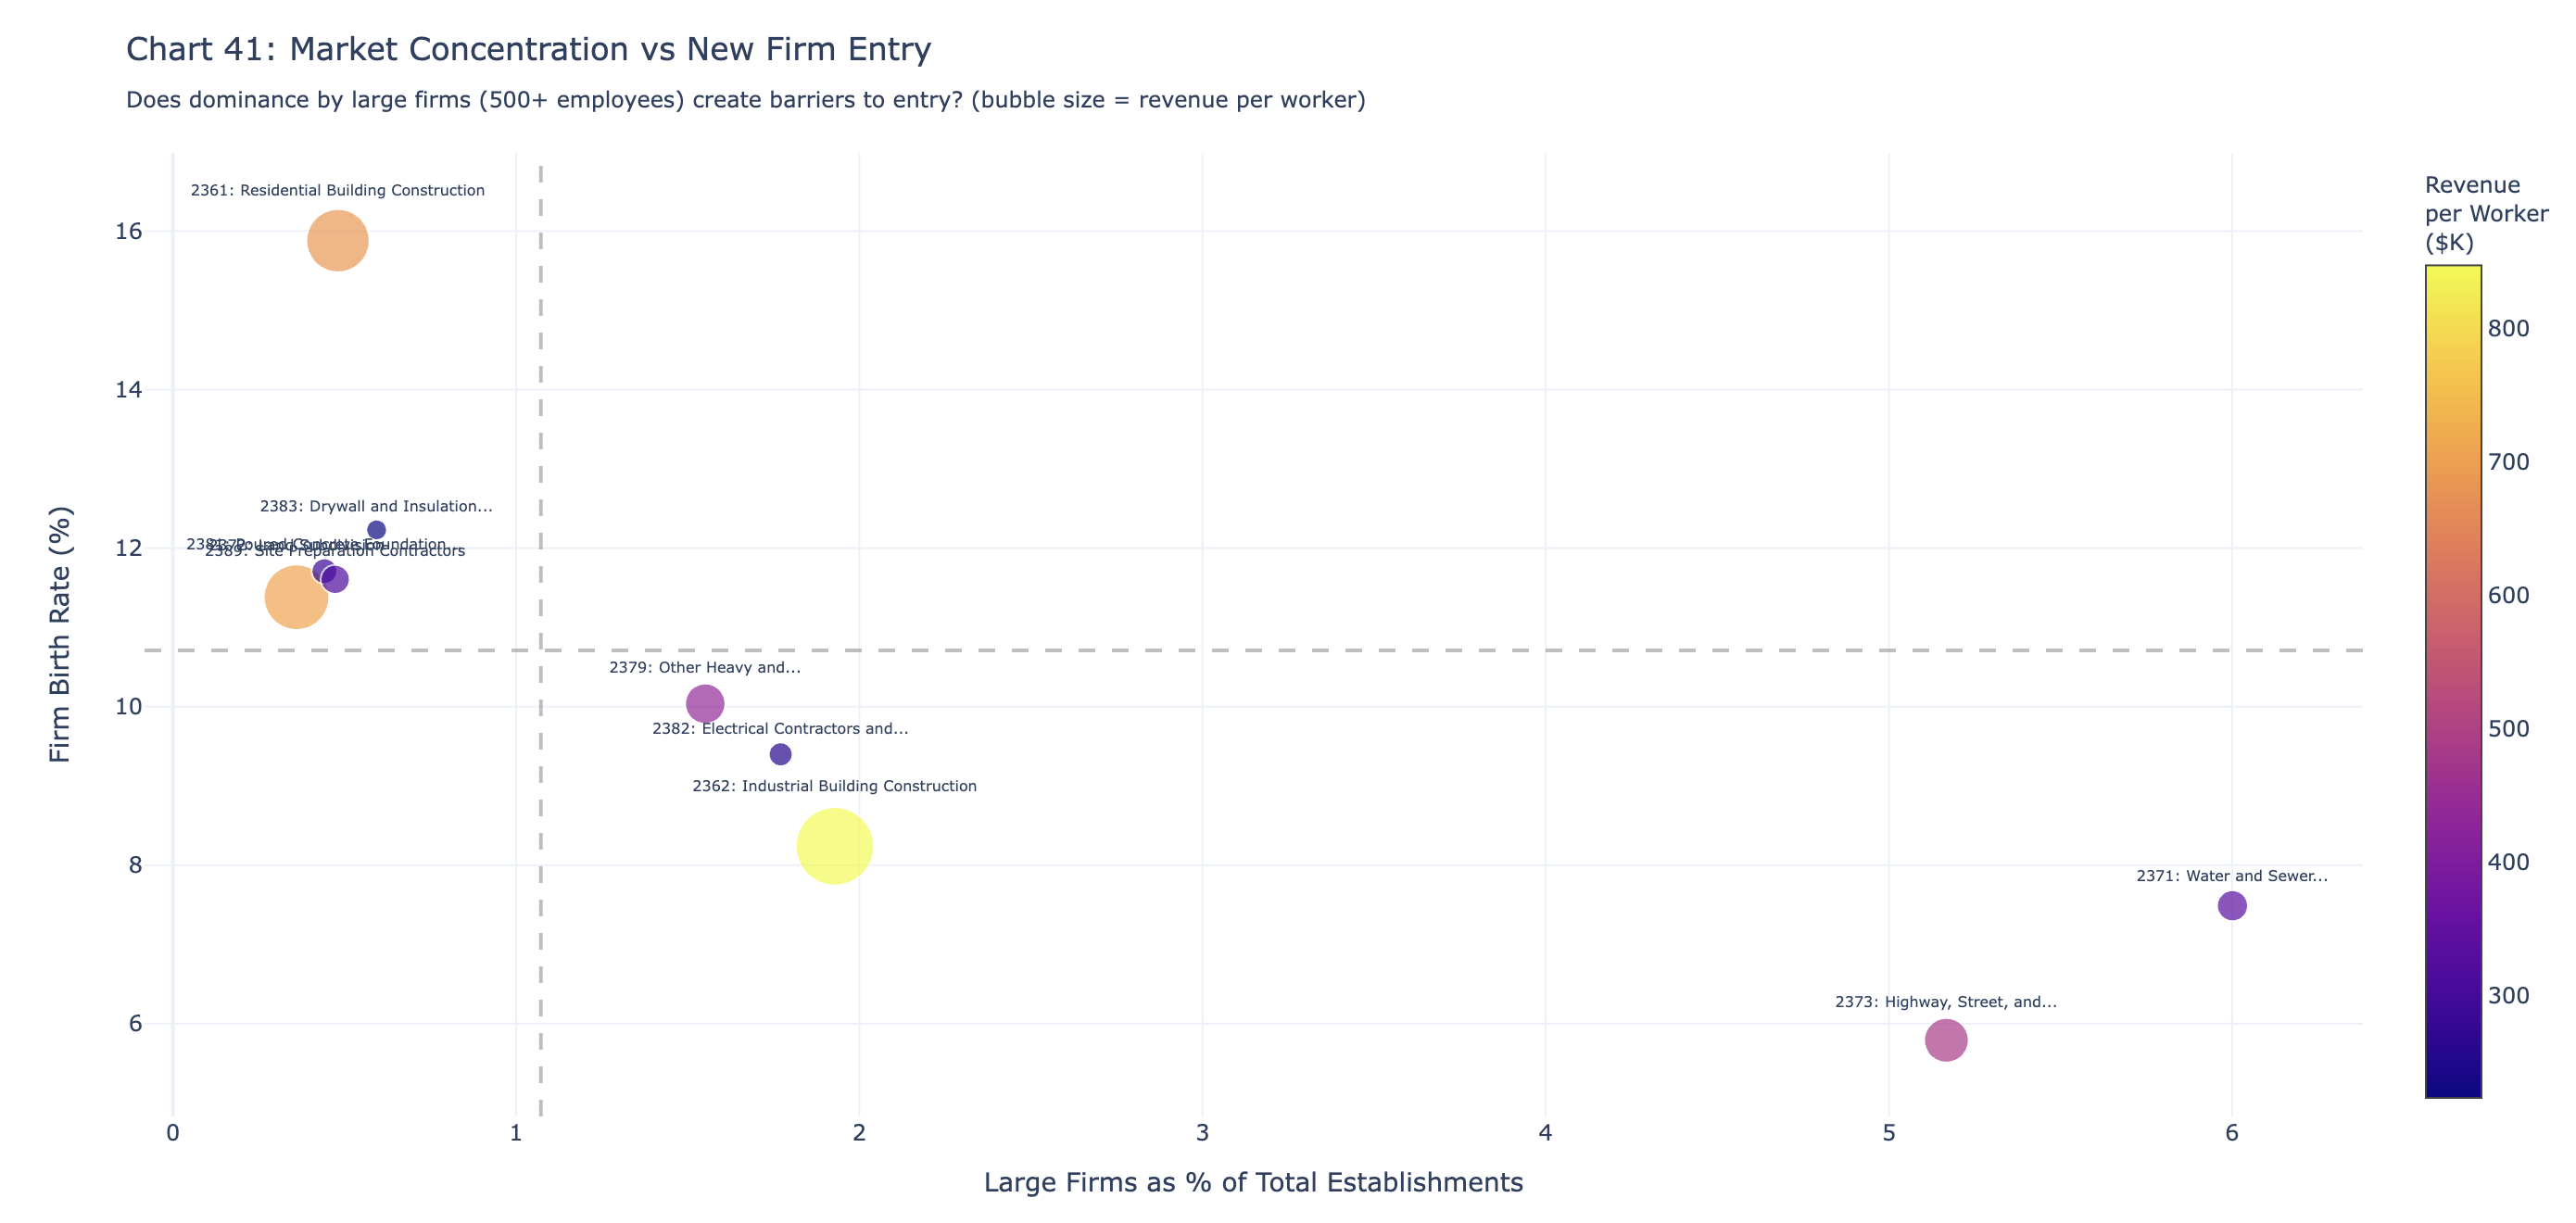
 While fragmentation & inefficiency isn’t unique to construction, the relentless churn only a few experience. Every year, 7-11% of construction firms disappear, enough to replace the entire ecosystem within a decade. And this isn’t just about company names changing on trucks; it’s about people. With a 10–15% annual job destruction rate, odds are high that almost everyone reading this knows someone who’s been caught in the reshuffling. This churn is offset by new firms created and most trades are actually expanding year over year, but that doesn’t mean it’s easy. There is clear markers of consolidation. Firm birth rates are noticeably lower in those trades dominated by mega-firms, suggesting that where giants rule, it’s hard for new players to even get started.
 The construction industry is a massive, dynamic, and vital ecosystem. With 85% of our 2050 building stock already built, the pressure on these trades to maintain and improve our world will only grow. With labor shortages across the office and field, the industry could use a hand.