I kept reading and hearing about copper being up, electrical equipment going up, tariffs, COVID, supply chains, data center build out. Electrical estimators frustrated with pricing jobs accurately. I read several theories but most seemed shallow at best or just using this to push a narrative at worst. Nobody really traced the money. Followed the trail from a copper mine in Chile to an Eaton factory in Mexico to a bid’s spreadsheet and contract.
I asked Claude to gather and graph relevant data to help me pull the thread. Seeing graphs brought more questions, which led to more data gathering and more graphs. After many cycles of this, what I learned surprised me.
Here’s what I found.
TLDR
If you don’t read further, here are the seven things I think every construction professional should know:
-
Copper is only 25-30% of a transformer’s cost. It’s a real input, but it’s not the primary reason equipment is expensive. A 100% copper price increase translates to only a ~28% input cost increase for a transformer. But transformers are up 85%.
-
Equipment manufacturing capacity shrank 10% since 2020 while demand surged. Steel mill capacity grew 24% over the same period. This explains why steel conduit prices recovered and transformer prices never did.
-
Manufacturers are pricing above their own input costs — and the gap is growing. Eaton’s Electrical Americas full-year operating margins expanded 500+ basis points to record highs. This isn’t cost passthrough. This is pricing power.
-
The copper price story is really about China building power grid infrastructure for 1.4 billion people. China went from 13% to 58% of global copper consumption since 2000. Data centers and EVs are less than 1% and 3% of global demand respectively — today.
-
Only 34% of construction contracts have material escalation clauses. The most widely used contract forms (AIA A101/A201) contain zero escalation provisions. Two-thirds of contractors have no contractual protection against 50-85% price increases.
-
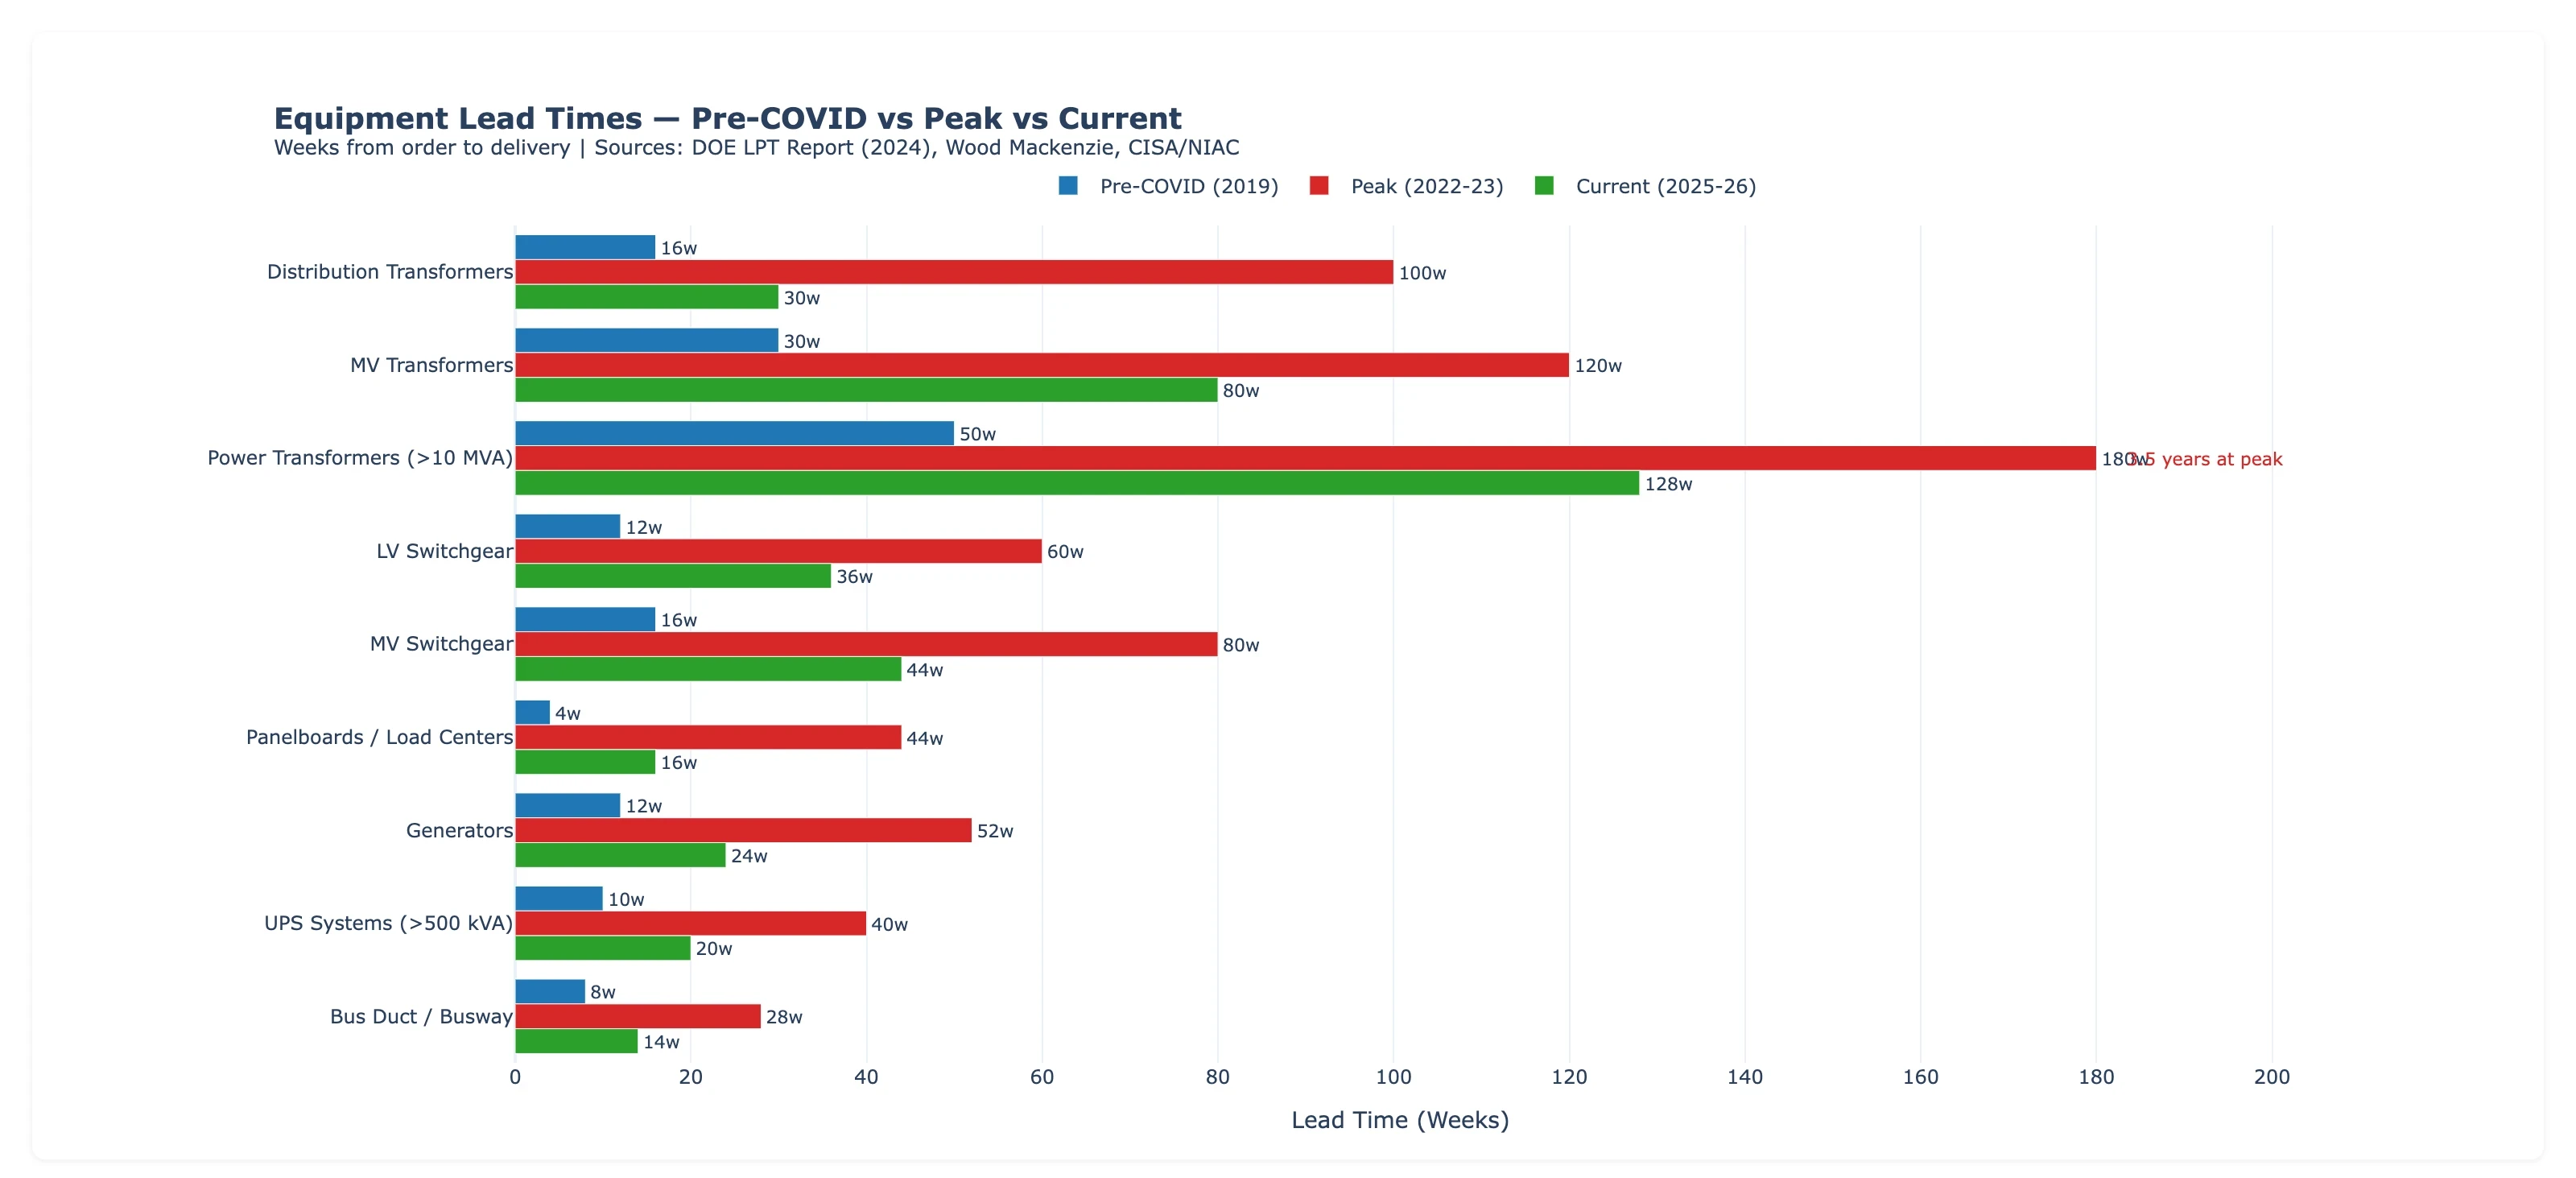
Equipment lead times are still 2-3x above pre-COVID norms. Power transformers are at 128 weeks — about 2.5 years. On a mid-size commercial project, the transformer lead time can exceed the entire project duration.
-
None of this is going back to “normal.” Equipment capacity is constrained, manufacturer backlogs stretch years, ore grades keep declining, and the electrification of everything keeps adding copper demand. This is structural, not cyclical.
What follows is how I got there.
The Scale of the Problem
Since January 2020, copper wire is up roughly 100%. Transformers and switchgear are up 75-85%. Panels are up about 50%. Motors and generators are up 40%. For comparison, general inflation (CPI) over the same period was 26%. Everything electrical is dramatically outpacing the broader economy.
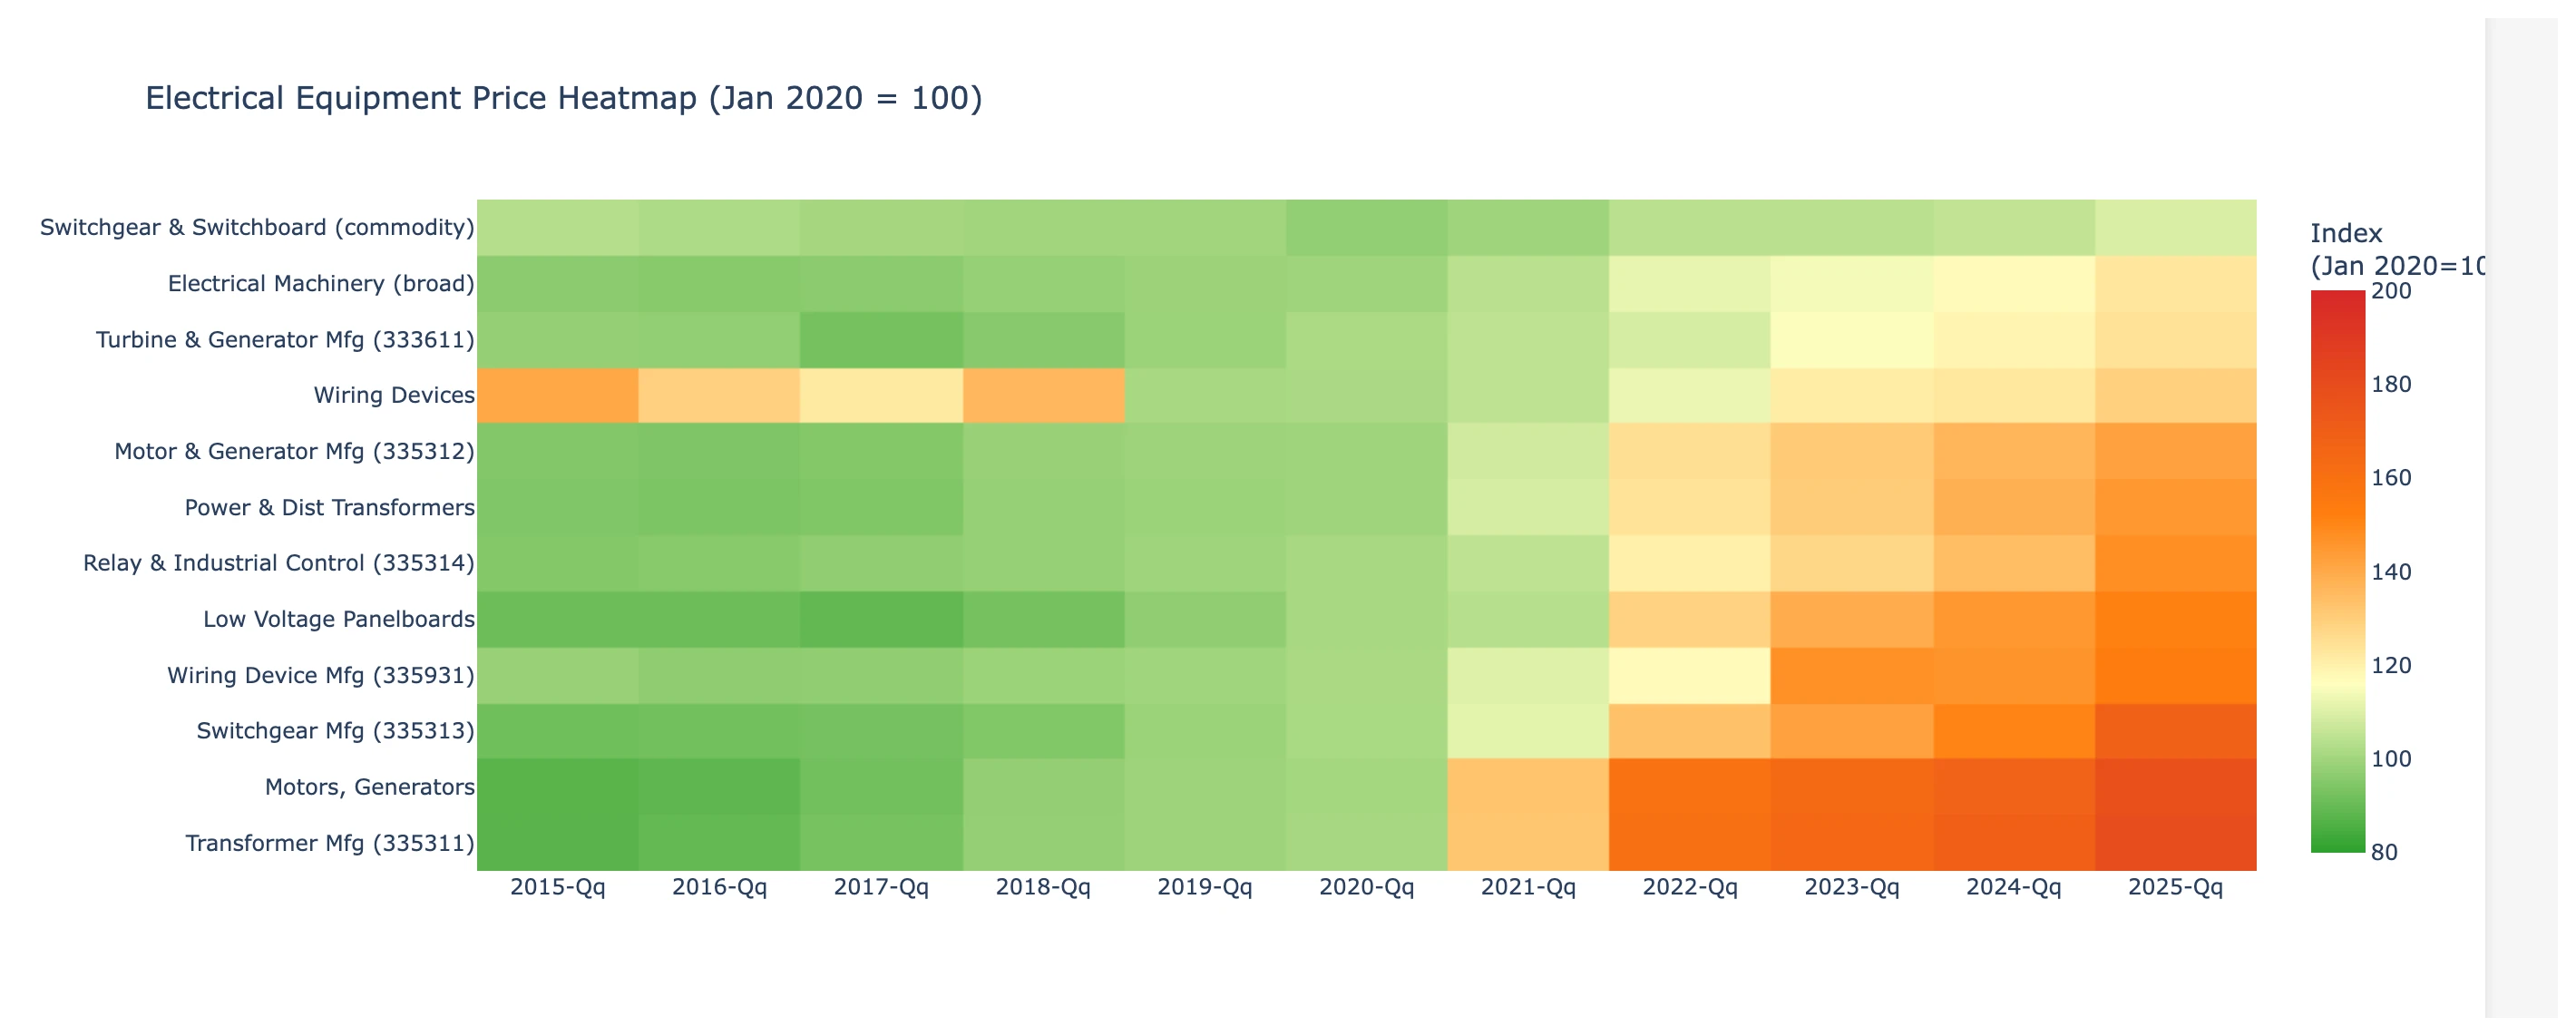
But the raw numbers hide the stranger part. When I plotted all these price indices together, they didn’t behave the same way.
Copper wire prices are volatile — they spike with the commodity and partially recover. Steel conduit had a massive spike in 2021 and then fully recovered to pre-pandemic levels. It’s the only major electrical material that did this.
Electrical equipment — transformers, switchgear, panels — did something different. The prices went up and just… stayed there. They never came back down.
![]()
Same pandemic shock. Same supply chain disruption. Same input cost spikes. Completely different outcomes. Steel conduit recovered. Equipment didn’t and keeps rising. Copper partially recovered and started rising again.
That’s the thread I pulled.
False Culprit: Copper
The first assumption I made was: if a transformer is mostly made of copper and copper is up, would that explain it? Looking at a transformer’s bill of materials, copper is only 25-30% of the total cost.
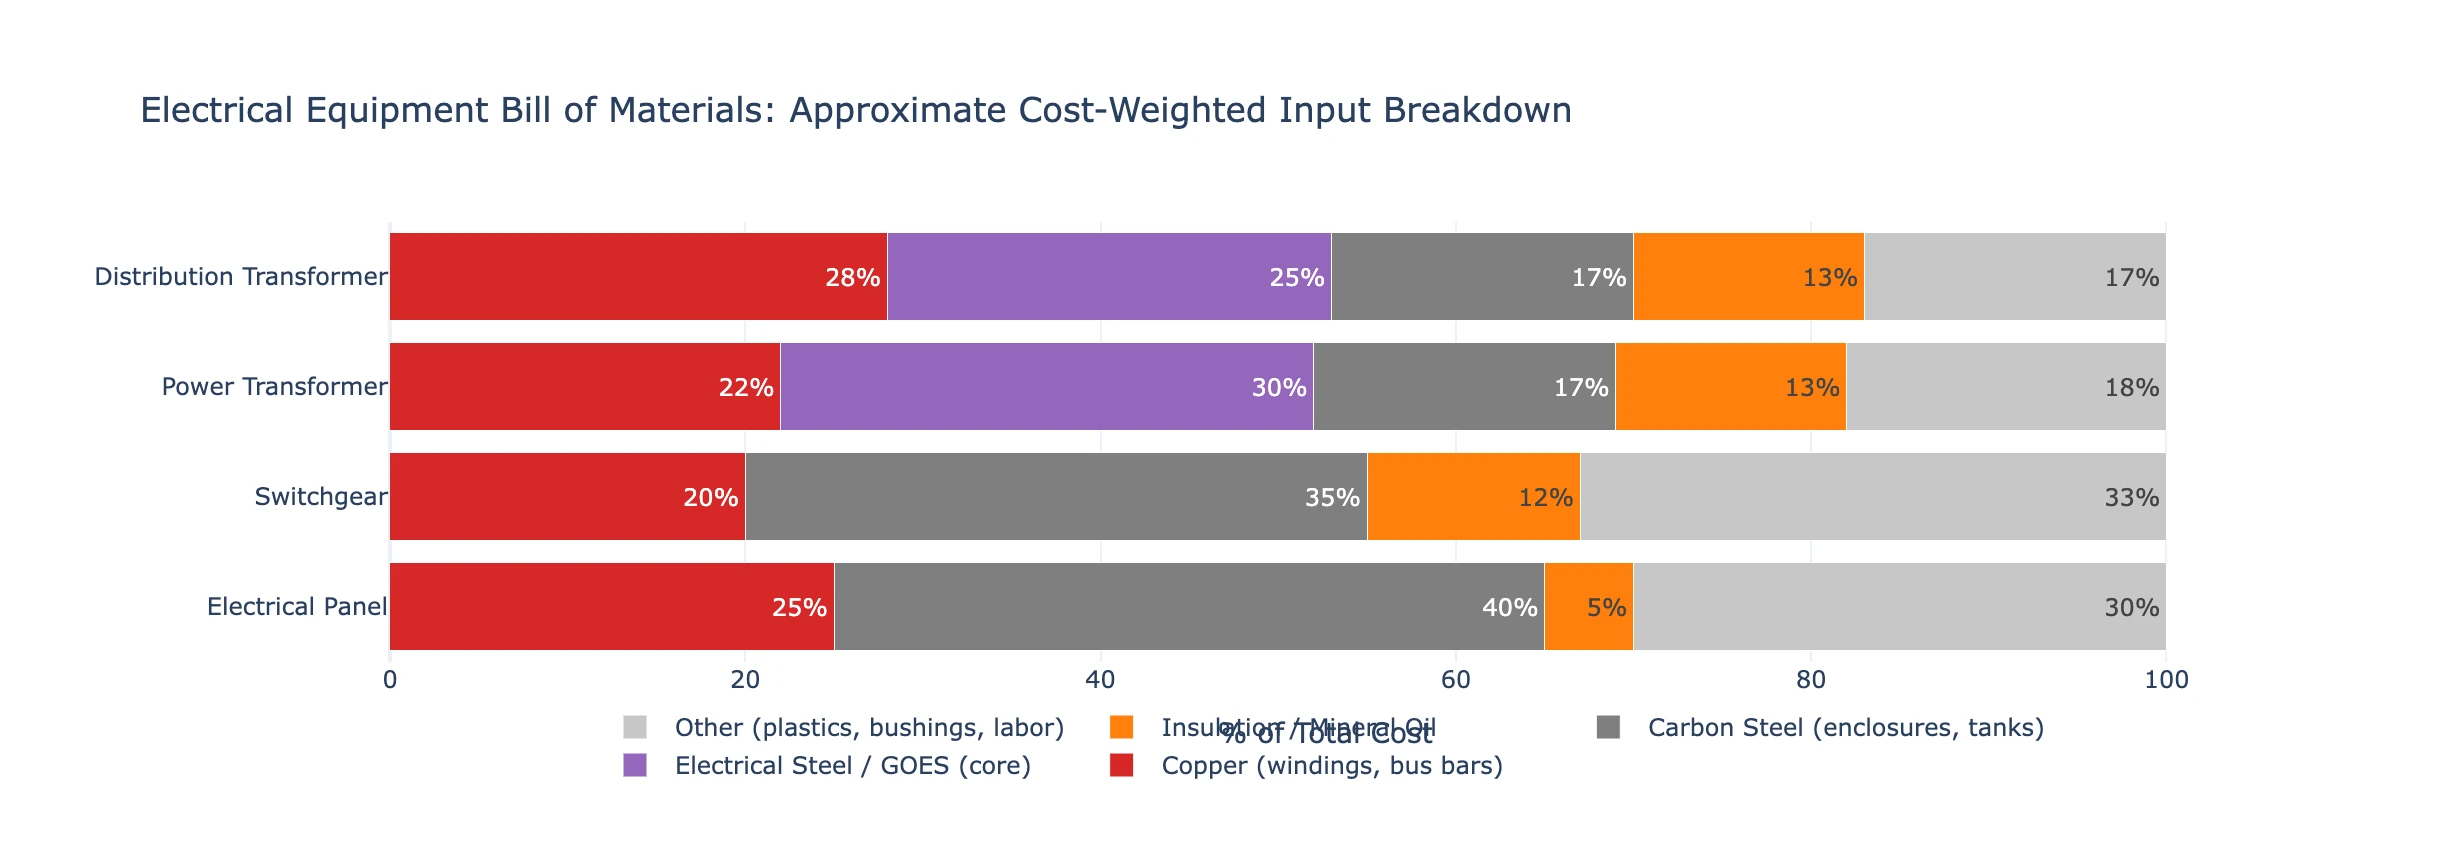
With only a quarter of total cost, even if copper doubled (which it did), that only accounts for roughly a quarter of a transformer’s price increase. But transformers are up 85%. Copper alone can’t explain the majority of the increase.
If you weight the bill of materials input costs of transformers, switchgear, and panels — applying real commodity indices for each component — you can answer: “What should this equipment cost if manufacturers were simply passing through their input costs?” The result: equipment prices are significantly higher than input costs alone, and the gap is widening.
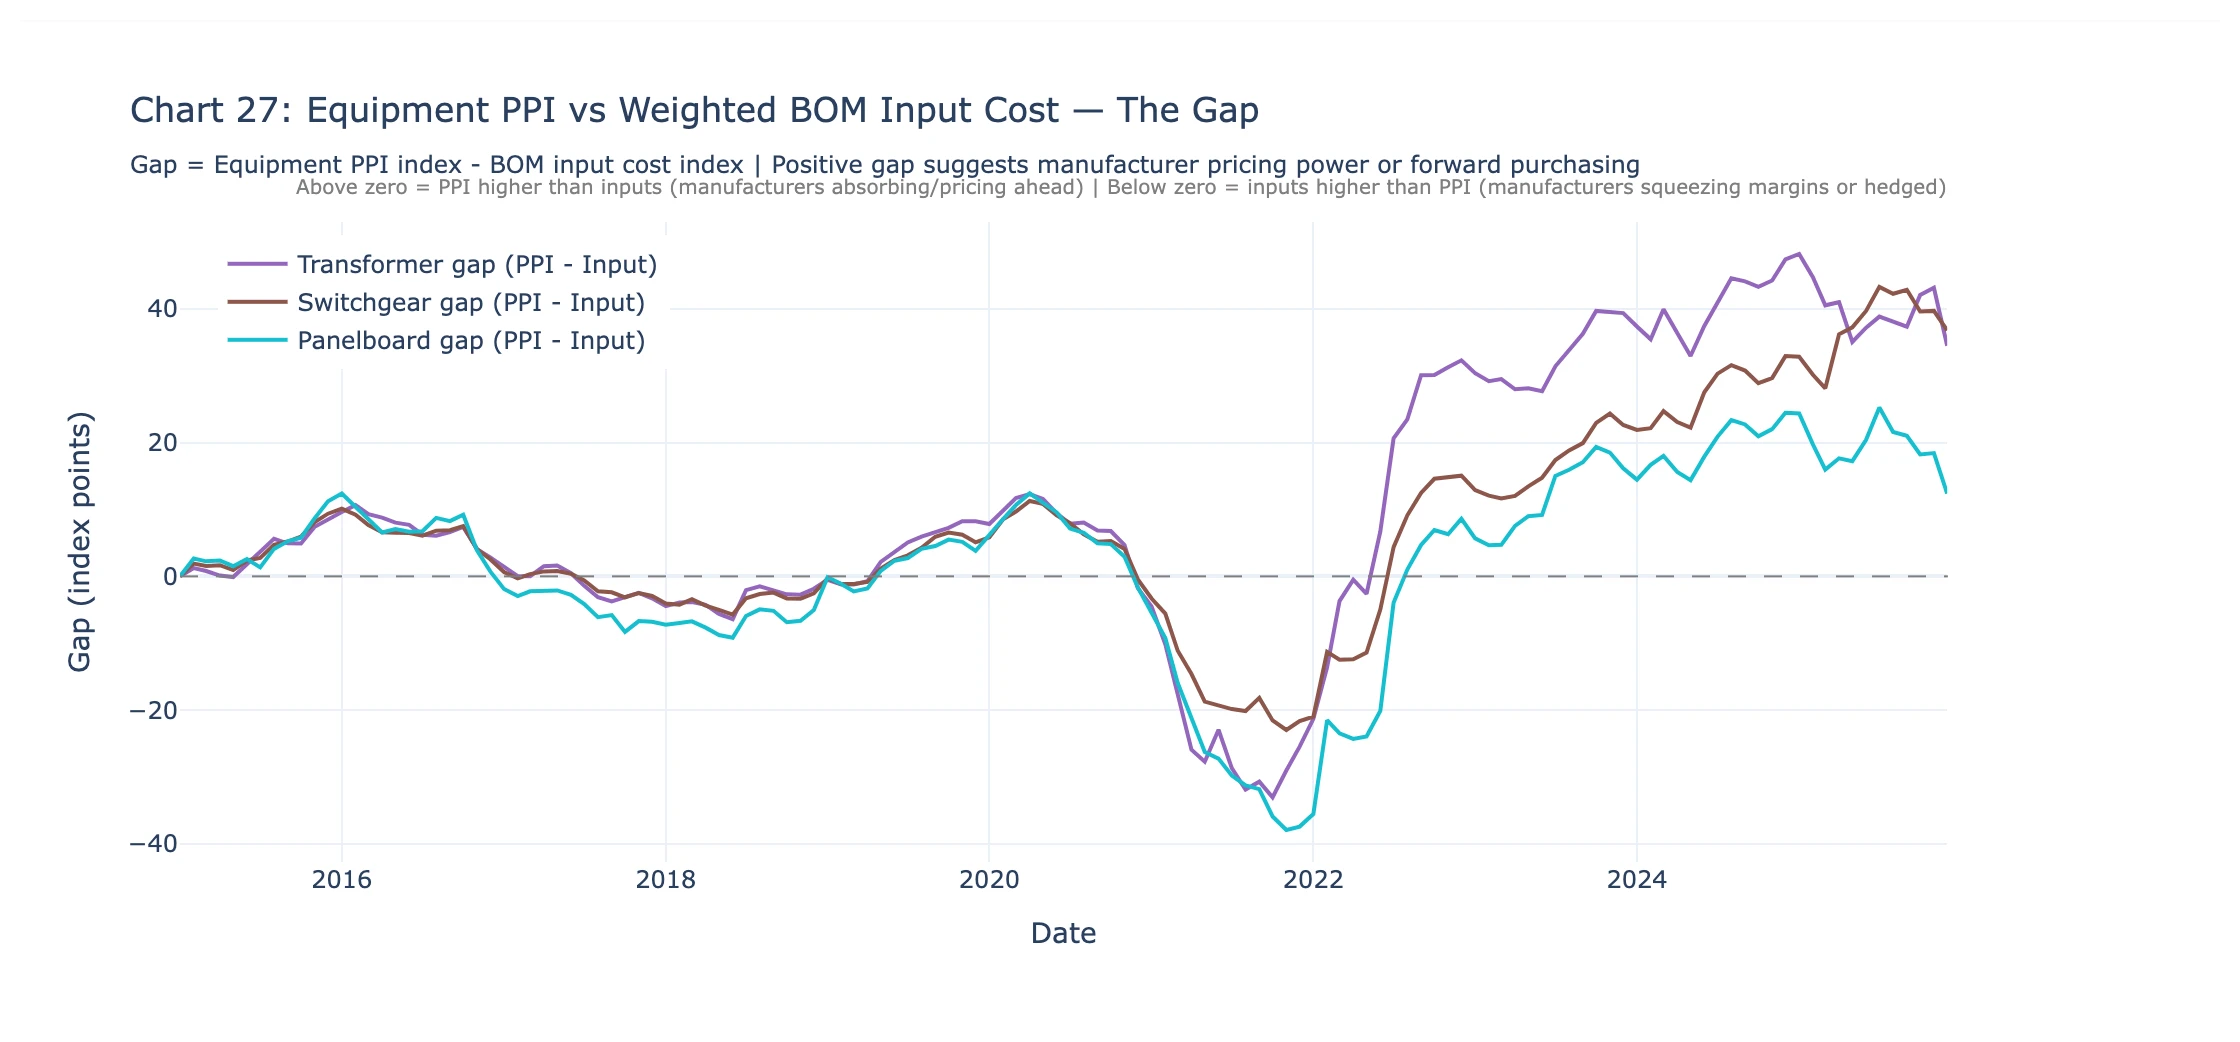
If manufacturers were simply passing through costs, that gap would stay roughly constant. Instead, it’s widening. Something else is going on.
What’s Actually Making Equipment Expensive
Three things. And they reinforce each other.
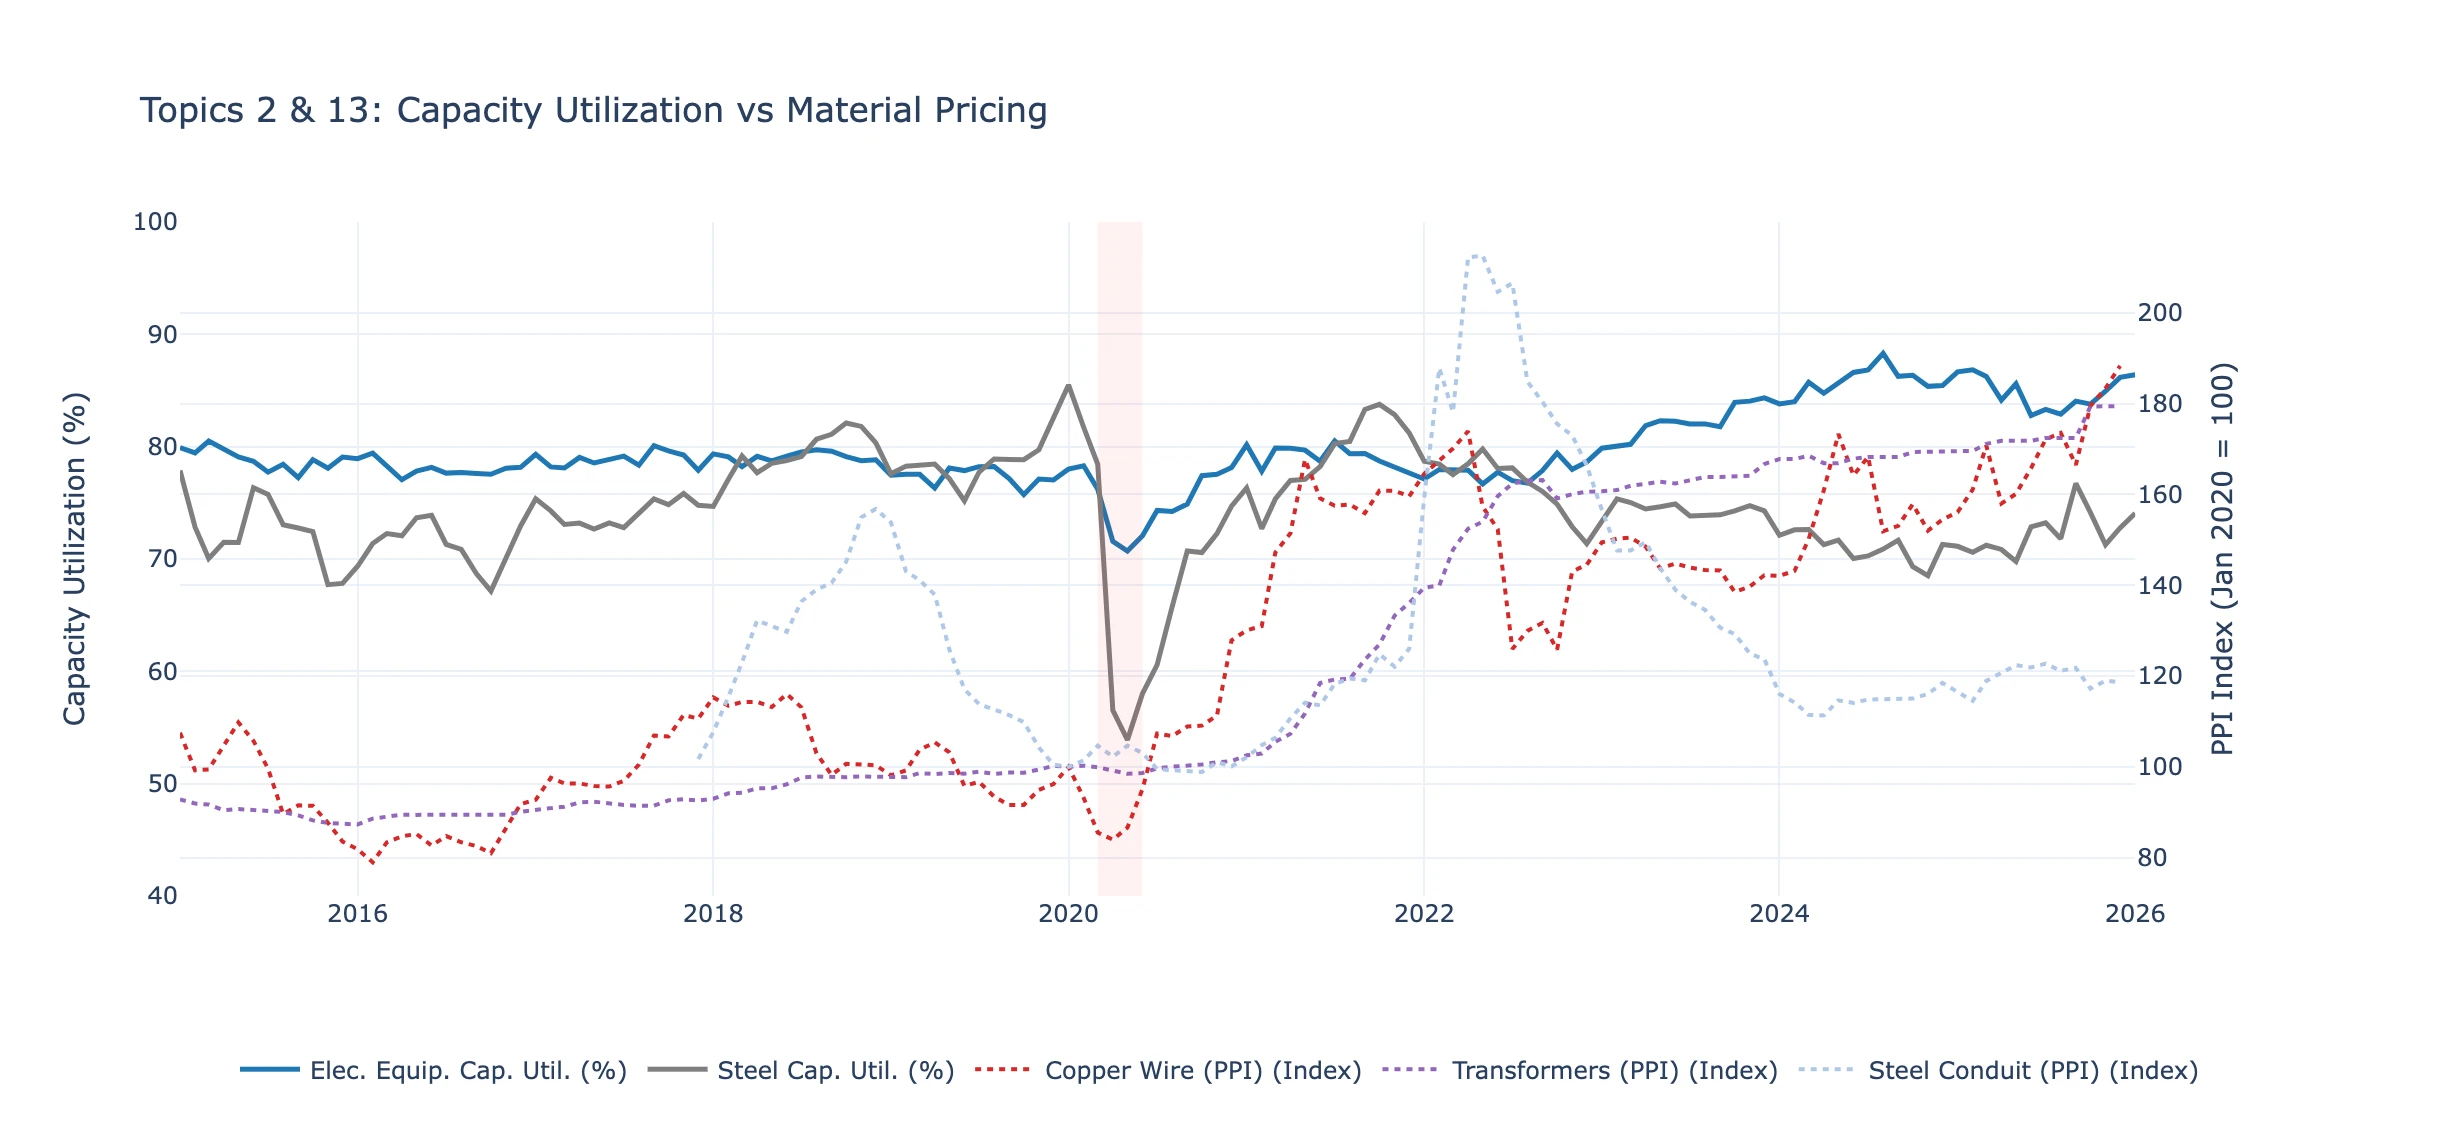
The factories that weren’t built
Since January 2020, electrical equipment manufacturing capacity shrank 10.1%. Meanwhile, steel manufacturing capacity grew 23.7%.
That single divergence explains the price divergence. When demand spiked, steel mills had headroom to ramp production. Prices spiked hard, then came back down. Electrical equipment manufacturers had no headroom. Prices went up and stayed up.
As of early 2026: electrical equipment is running at 86.4% capacity utilization. Steel is at 74%. One is maxed out. One has slack. And the price behavior follows exactly.
Data centers ate the supply
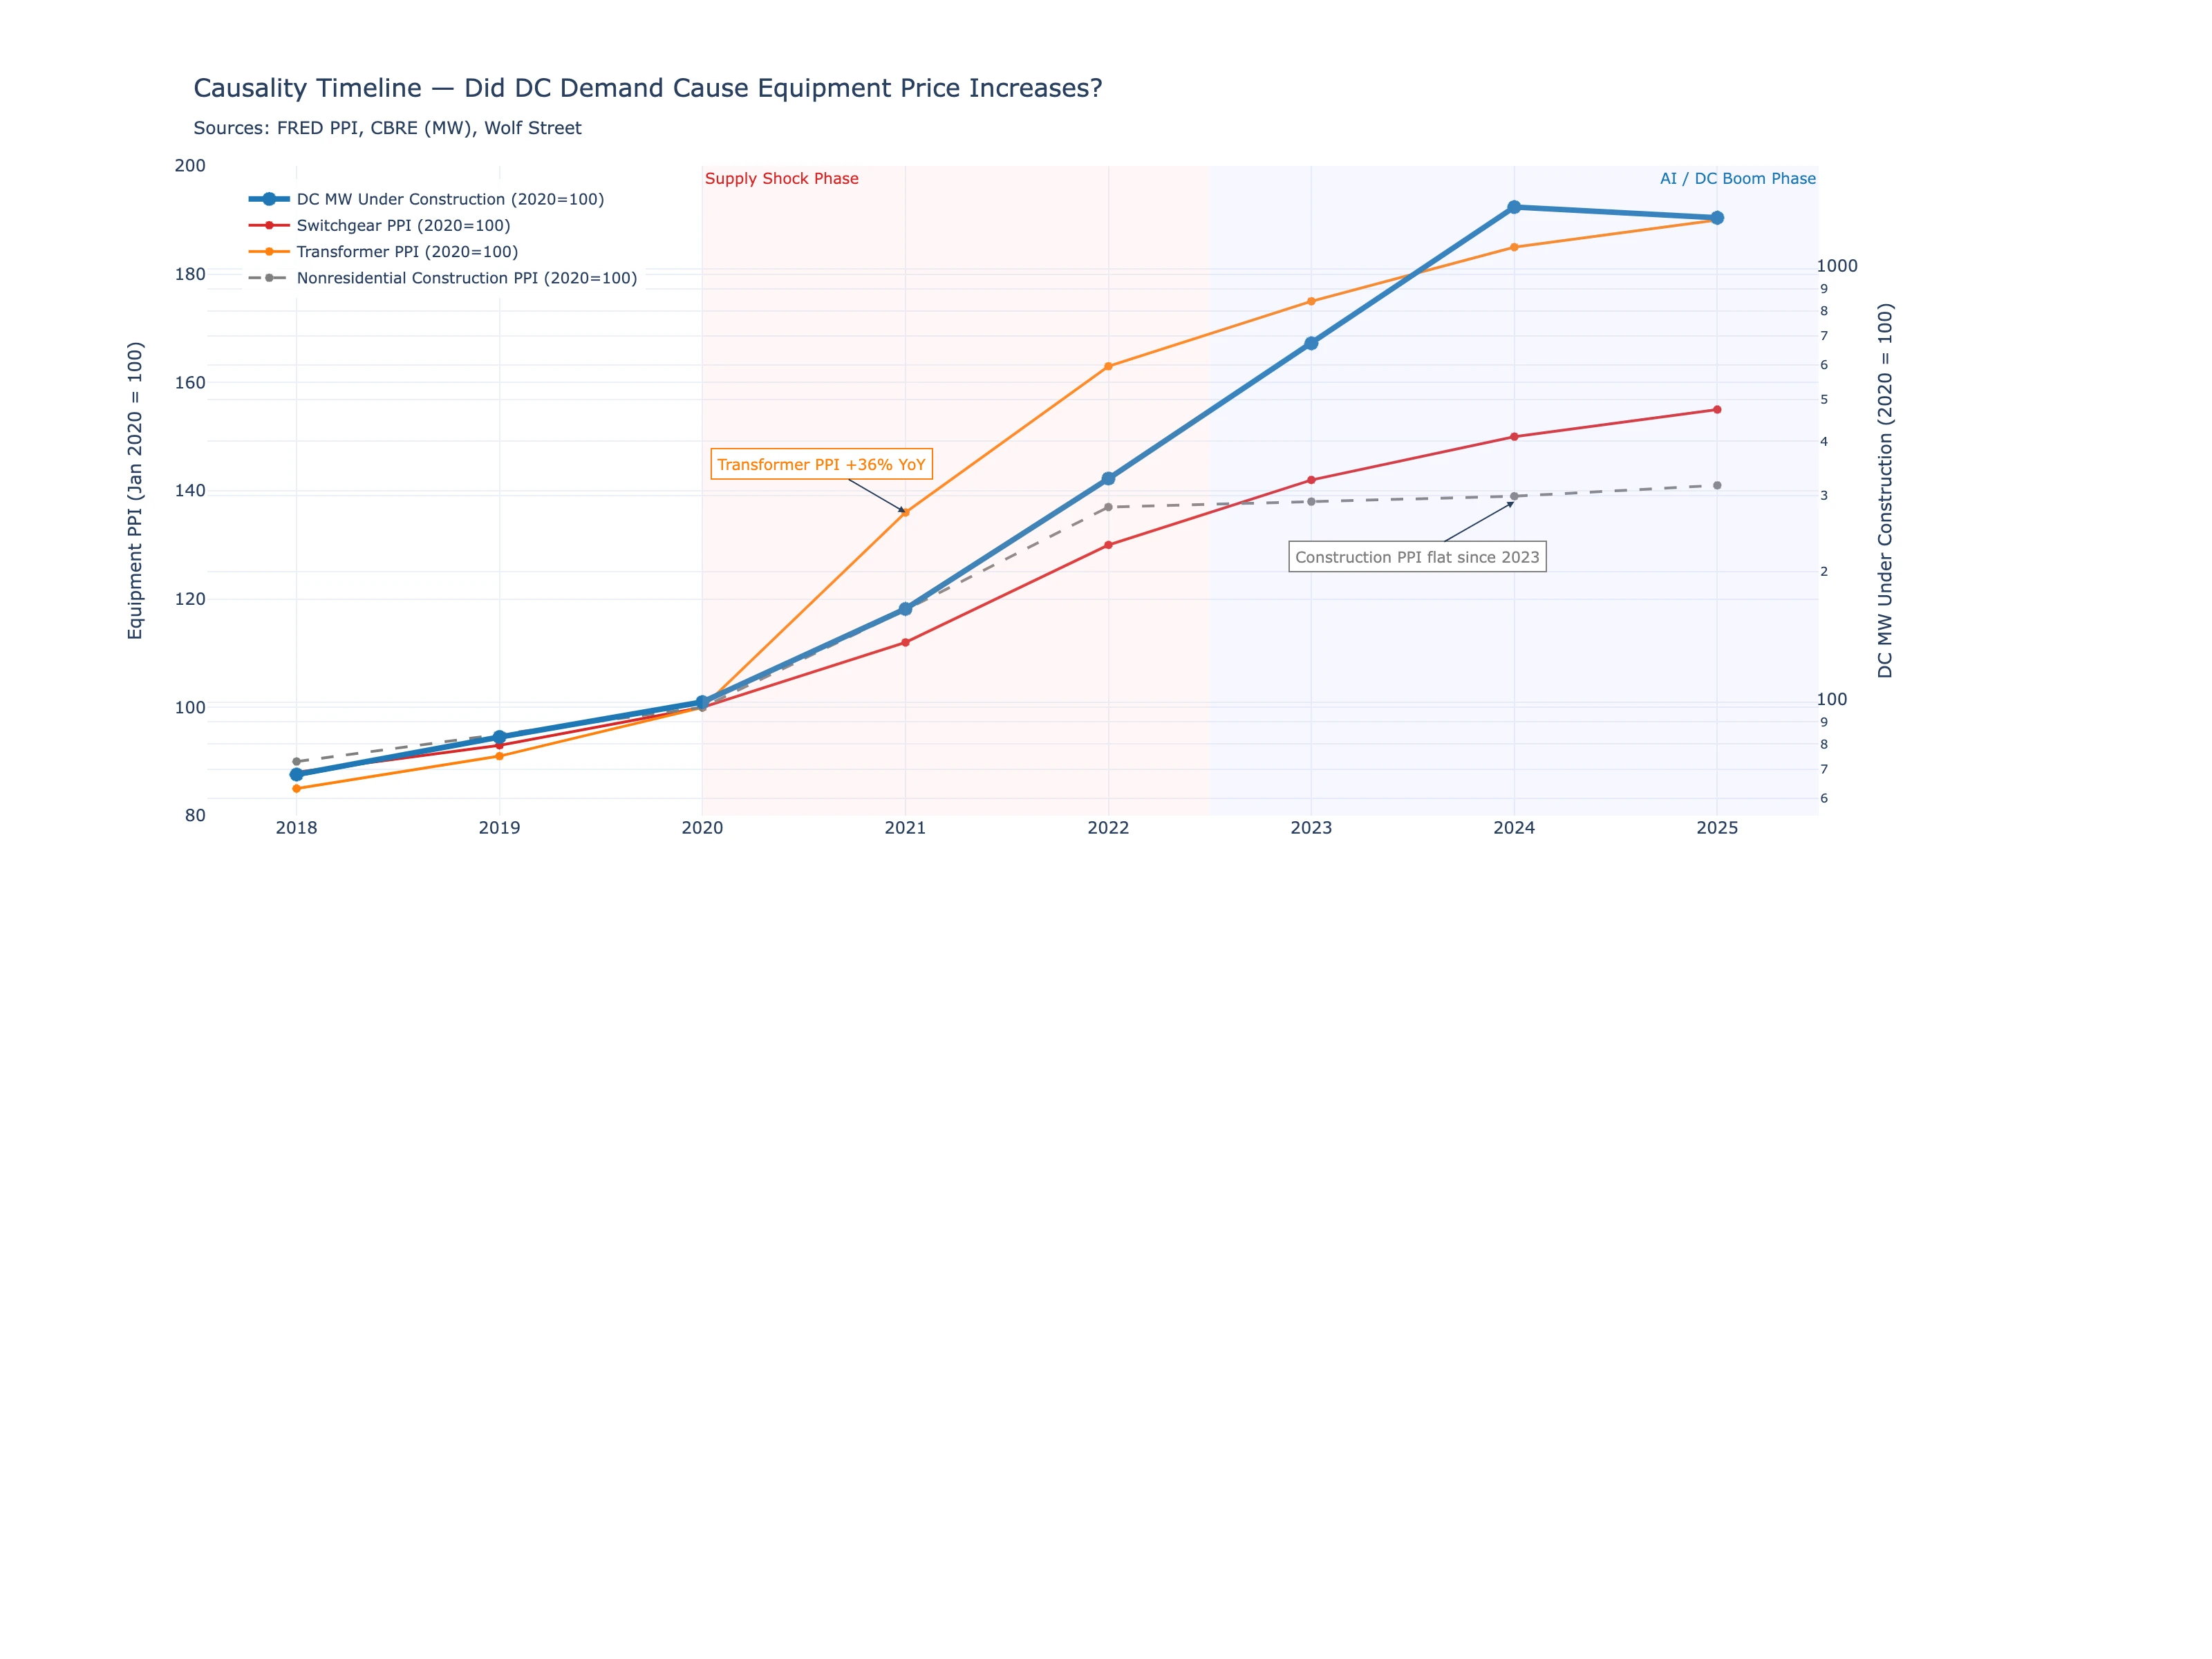
In 2020, there were 457 megawatts of data center capacity under construction across North America. By the second half of 2024, that number was 6,350 MW. The growth came in two phases — a steady rise through 2022, then an AI-driven explosion.
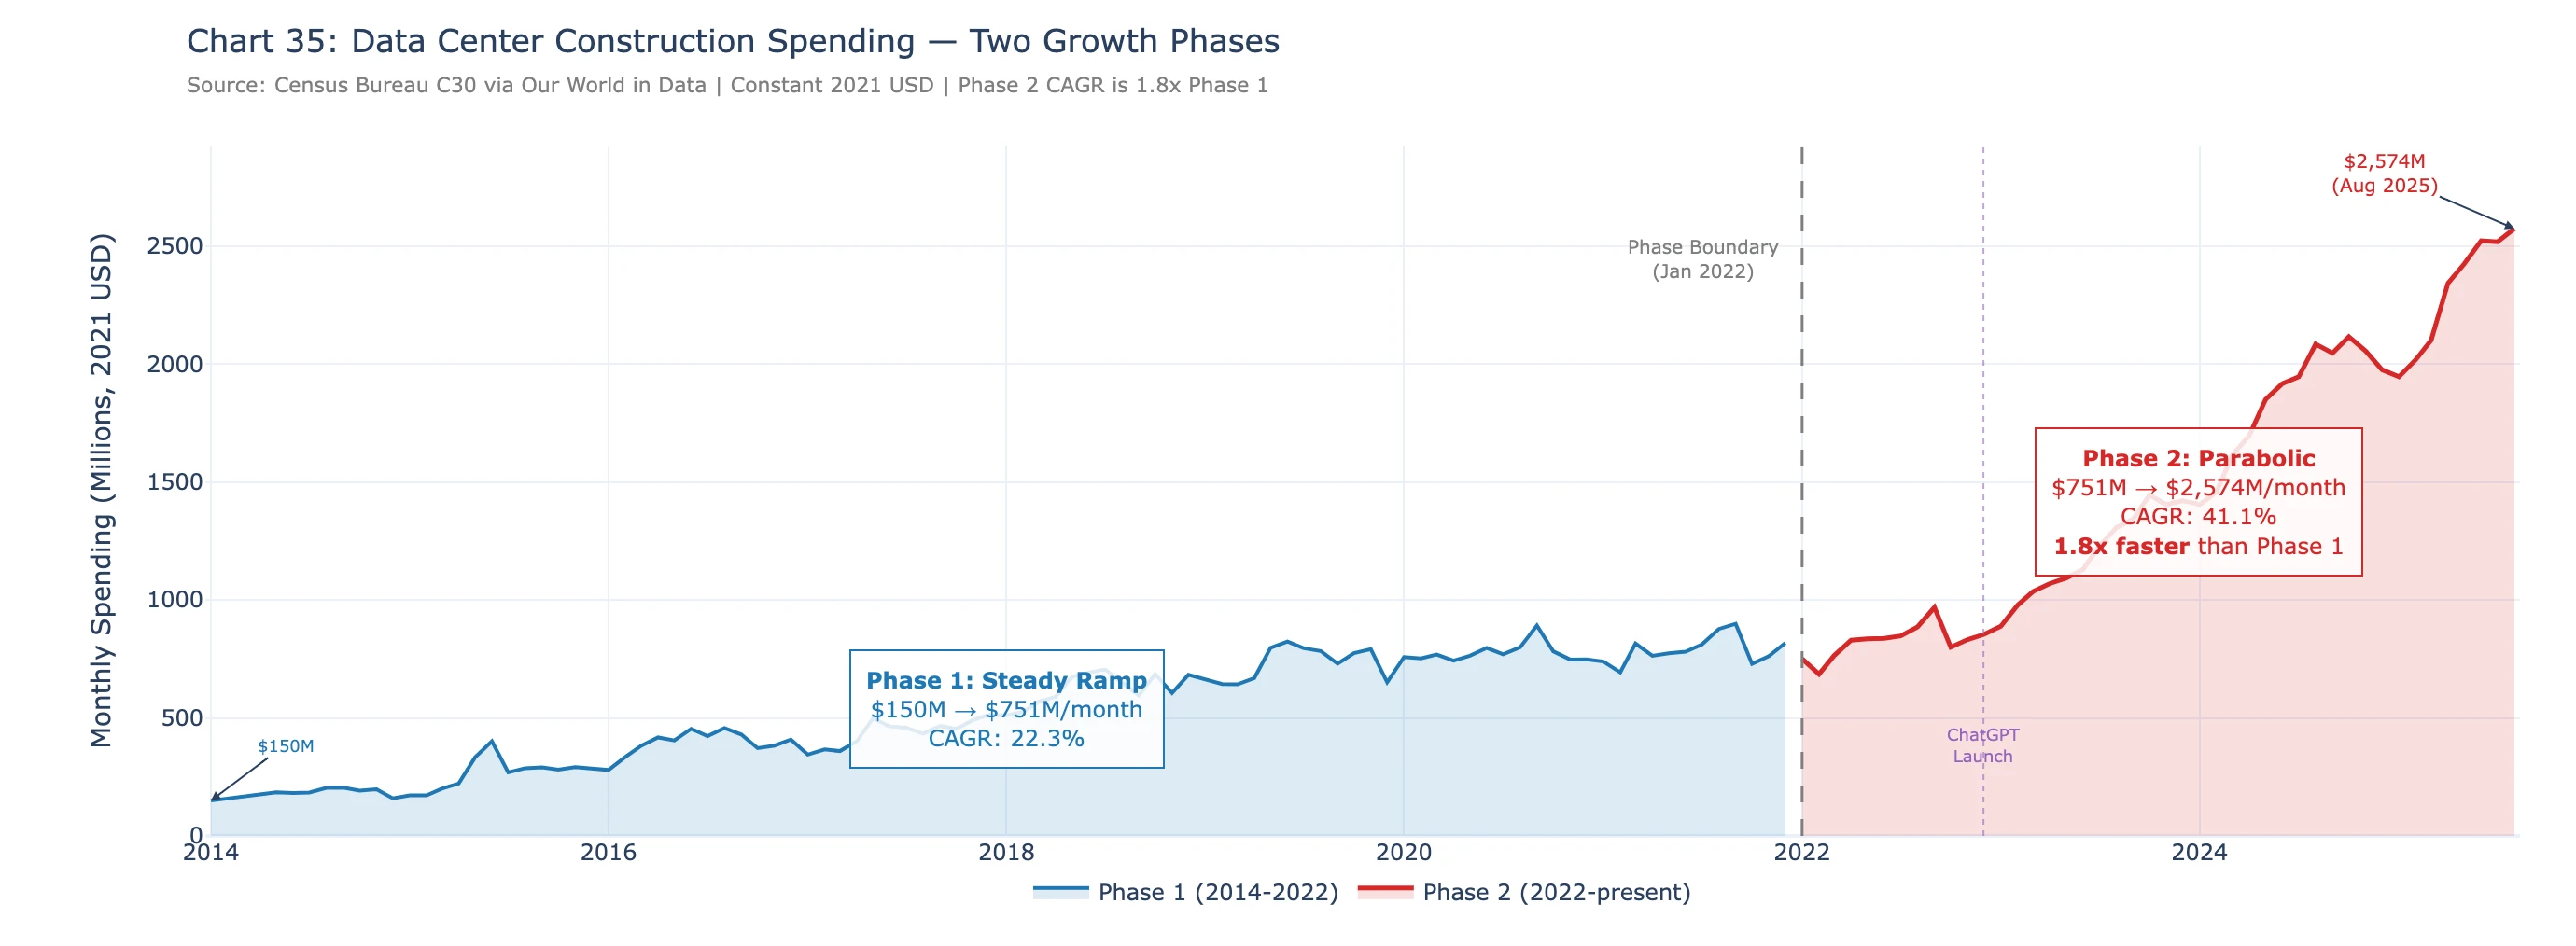
Data centers are extraordinarily equipment-intensive. Electrical systems represent 45-70% of total data center construction cost — far more than any other building type.
The timing is important. Equipment prices ratcheted up before the data center boom. Transformer prices surged about 90% during 2020-2022, driven by COVID disruption, the Ukraine conflict, and electrical steel prices doubling. The AI-driven data center wave started in 2022-2023 — after prices had already jumped. But with power transformer lead times at 128 weeks and switchgear at 44 weeks, the full impact of data center demand is still working through the system. More on those lead times later.
Follow the money to the manufacturer
Eaton Corporation’s Electrical Americas segment — the largest manufacturer of electrical distribution equipment in North America — reported quarterly operating margins of 23% in Q4 2022. By Q4 2024, those margins hit 31.6%. Full-year segment margins reached roughly 28-29% — still record-breaking, still an expansion of 500+ basis points in two years.
This is in their public SEC filings. Schneider Electric explicitly attributes its margin improvement to “pricing” in its annual reports. ABB’s Electrification segment shows similar trends.
If these companies were simply passing through commodity costs with a fixed markup, their margins would be roughly flat. Instead, margins are at record highs. The companies are pricing above their input cost increases, and constrained supply plus surging demand means customers pay.
This isn’t nefarious. It’s what happens in any concentrated industry where demand exceeds supply. There are only a handful of companies that can build a 2500 kVA medium-voltage transformer: Eaton, ABB, Schneider, Siemens, GE Vernova. When all of them have multi-year backlogs, there’s no competitive pressure to discount.
So the answer to why equipment is expensive is three things working together:
- Manufacturing capacity shrank — there aren’t enough factories.
- Data centers absorbed the supply — every factory is booked for years.
- Manufacturers raised prices above input costs — because they can.
Copper is a real input cost. But it explains roughly a quarter of the price increase. The rest is these three structural factors.
What’s Actually Driving Copper Prices
Equipment prices aren’t mainly about copper. But copper is up roughly 400% since 2000 and 100% since 2020. At $5.82 per pound as of March 2026, it has overshot every major institutional price forecast. So what’s driving it?
The answer is less exciting than the headlines suggest.
China built a power grid for 1.4 billion people
The single biggest reason copper is structurally more expensive is that China went from consuming 13% of global copper in 2000 to 58% in 2024 — an 8x increase in absolute tonnage — while US consumption stayed essentially flat.
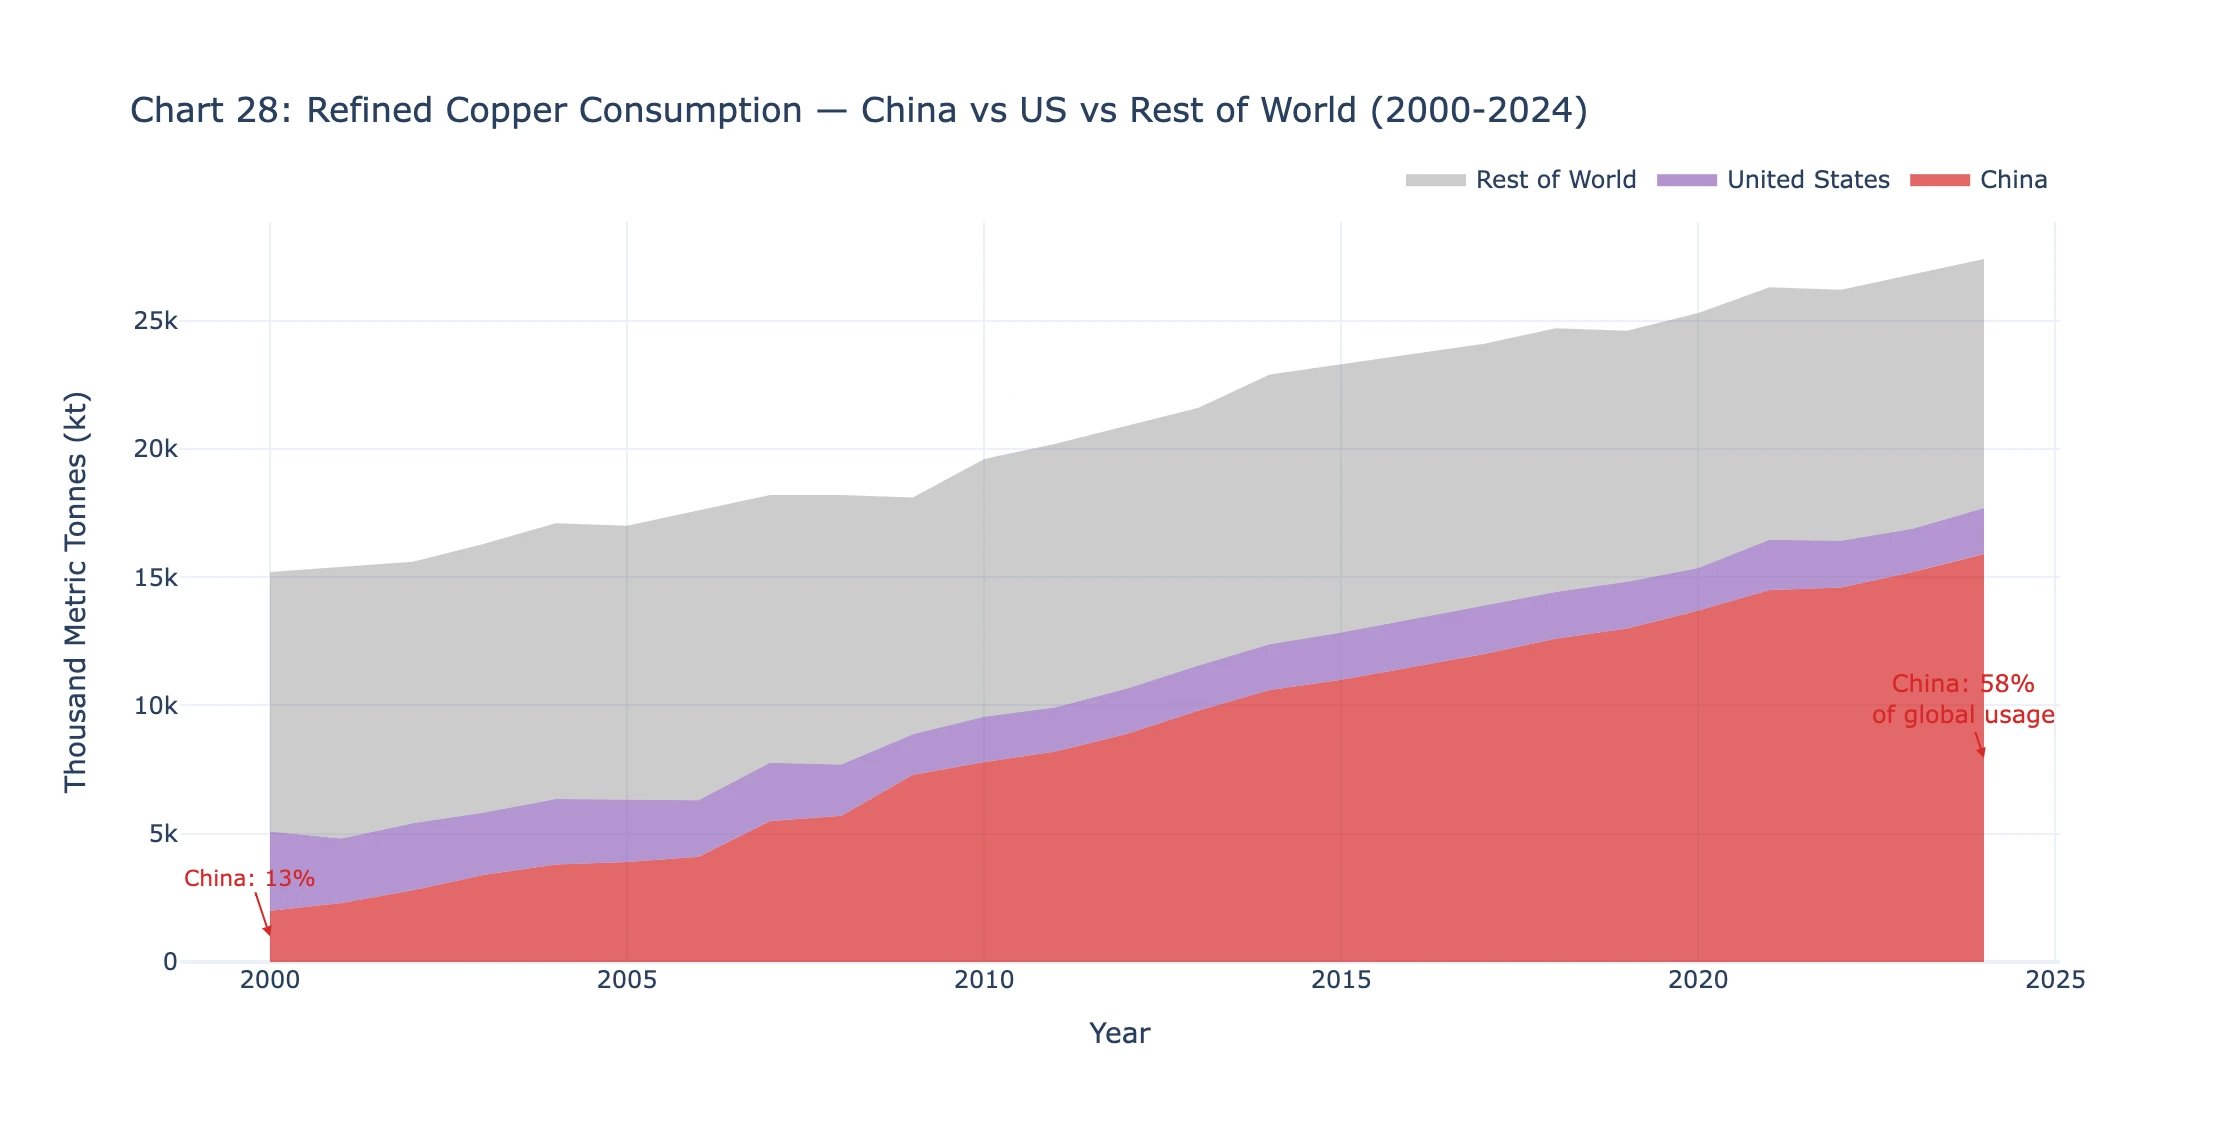
And what does China use all this copper for? Forty-eight percent goes to power grid infrastructure. State Grid Corporation of China and Southern Power Grid invested over $300 billion in grid modernization from 2020 to 2024 and connected 1,100 gigawatts of renewable generation.
This is government-directed investment, not market-dependent. That demand isn’t going away. And regardless of US domestic production, copper is priced on global markets — China’s consumption sets the price for everyone.
It’s getting harder to mine
Average copper ore grade has declined from about 4% copper content in 1900 to about 0.58% today. Miners now process roughly 172 tonnes of rock to produce one tonne of copper, compared to 25 tonnes a century ago.
More rock means more energy, more water, more equipment, more cost. All-in sustaining costs (AISC) sit at about $2.45 per pound, creating a structural price floor. When copper falls below that, mines shut down until prices recover. And that floor keeps rising because ore grades only go down.
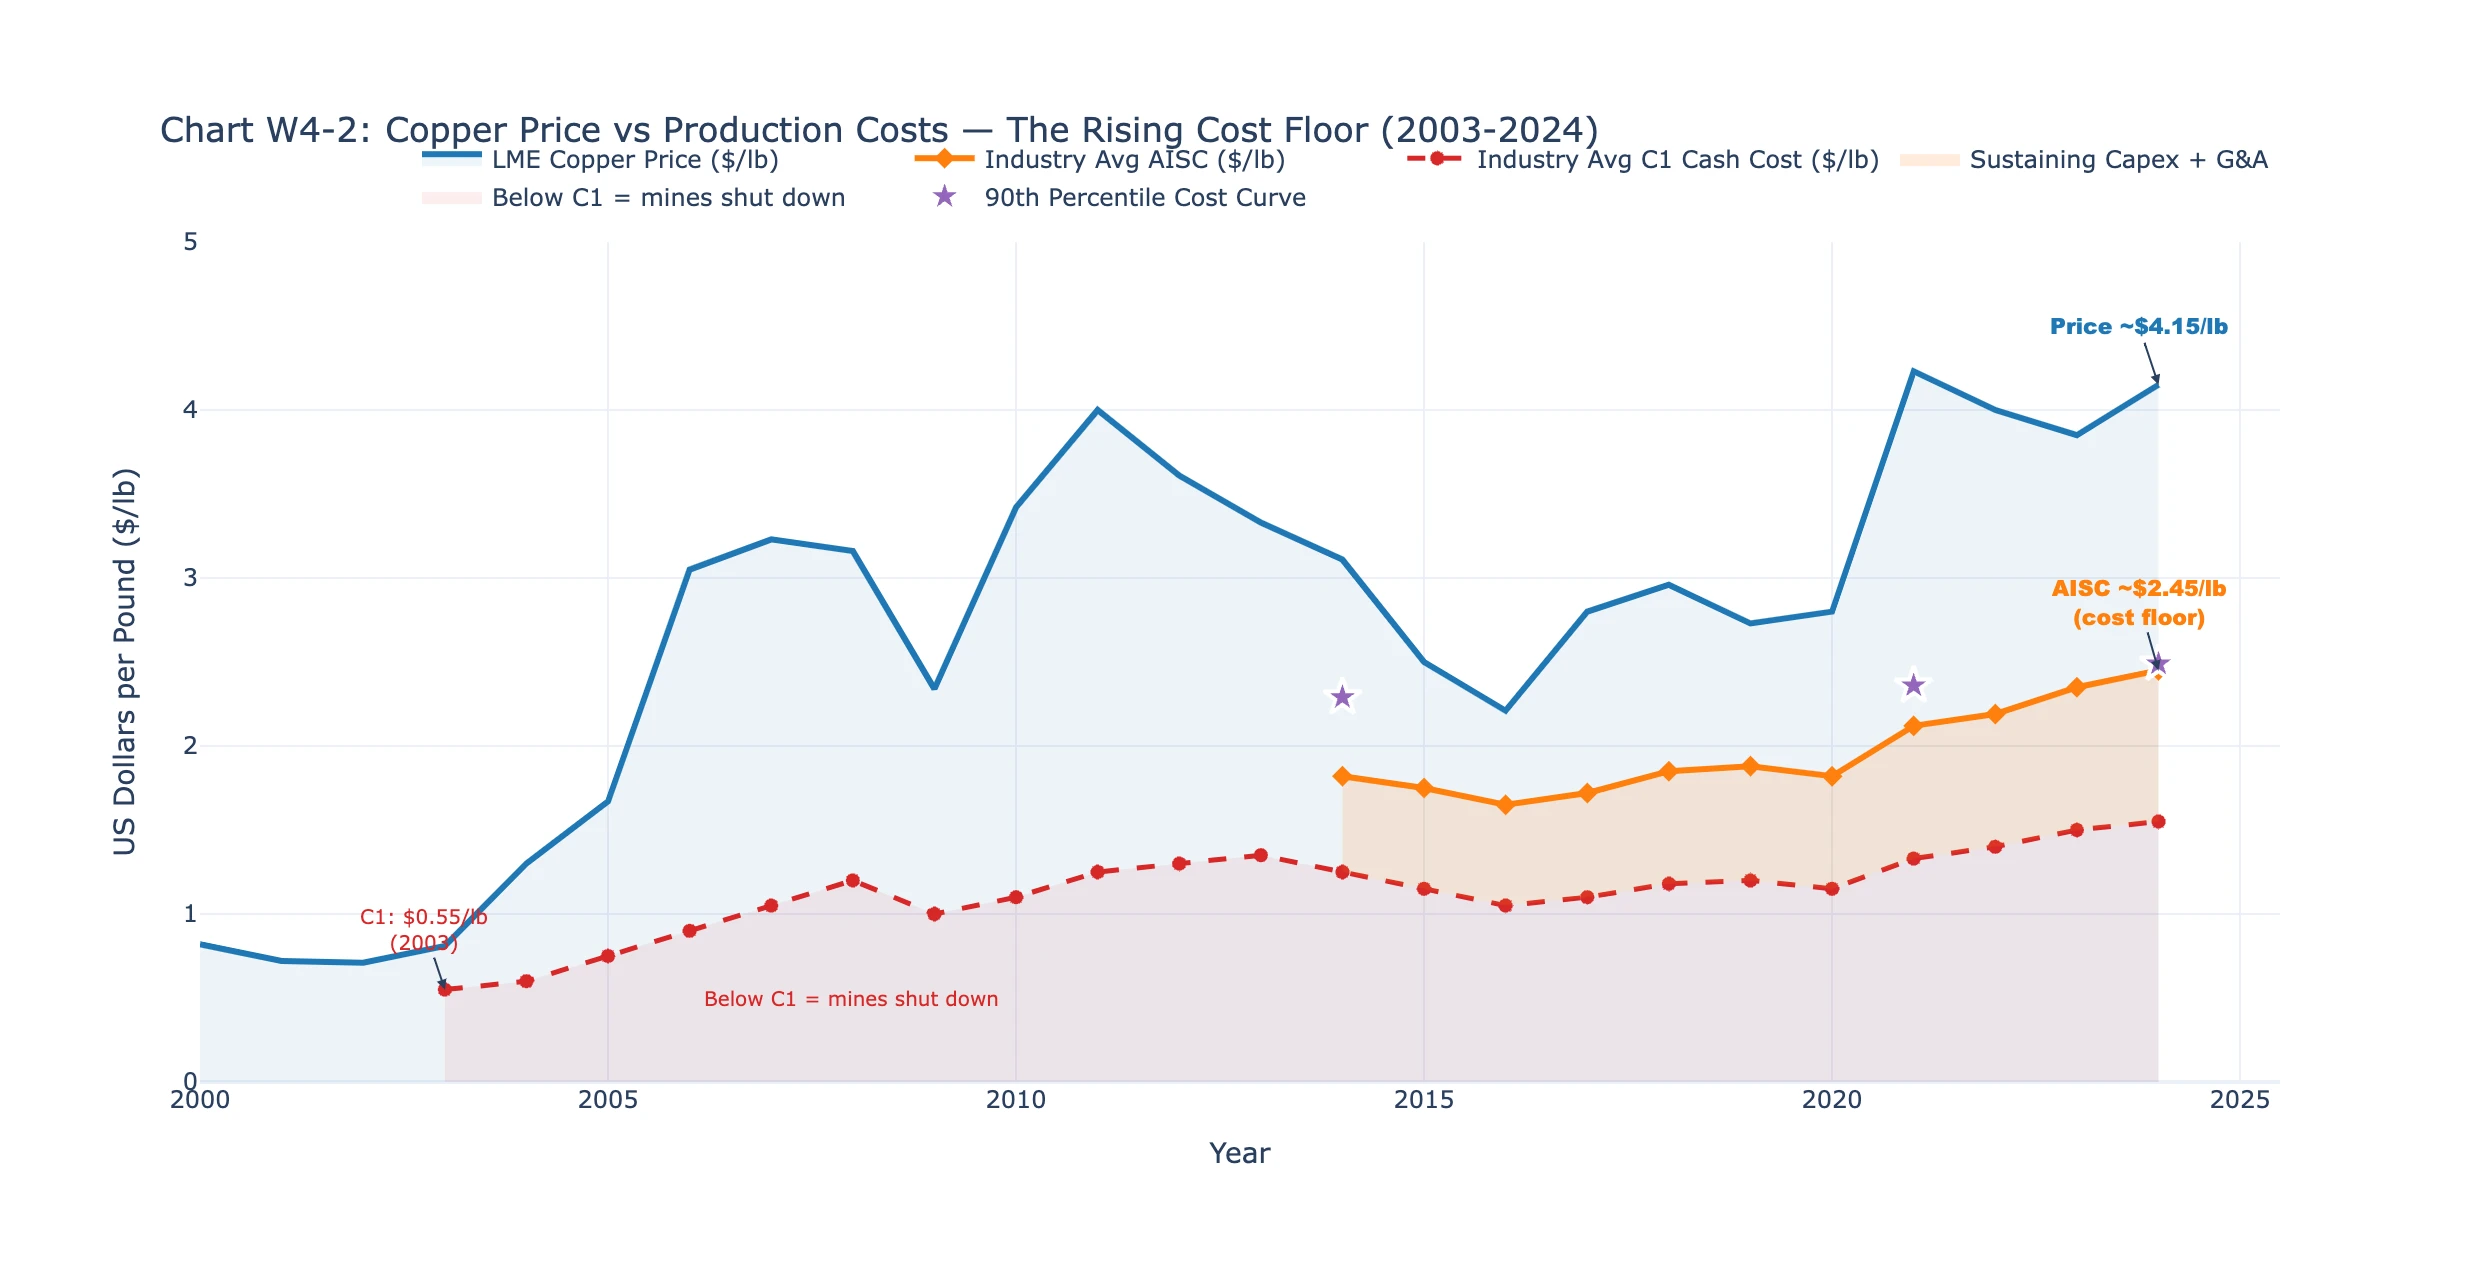
The earth has plenty of copper — the USGS estimates identified resources of over 2.1 billion tonnes. Running out isn’t the problem. The problem is that the easy copper is gone. What’s left is deeper, lower grade, harder to permit, and more expensive to extract. Capital intensity rose from about $4,500 per tonne of annual capacity in 2000 to about $22,000 today. At current costs, a new mine needs copper above $4.00 per pound to justify the investment — and it takes an average of 29 years from discovery to production.
What about data centers and EVs?
This is where the popular narrative is premature rather than wrong. It better describes 2030 than today.
When I looked at how the global copper end-use mix has shifted since 2000, the biggest changes weren’t where most people expect:
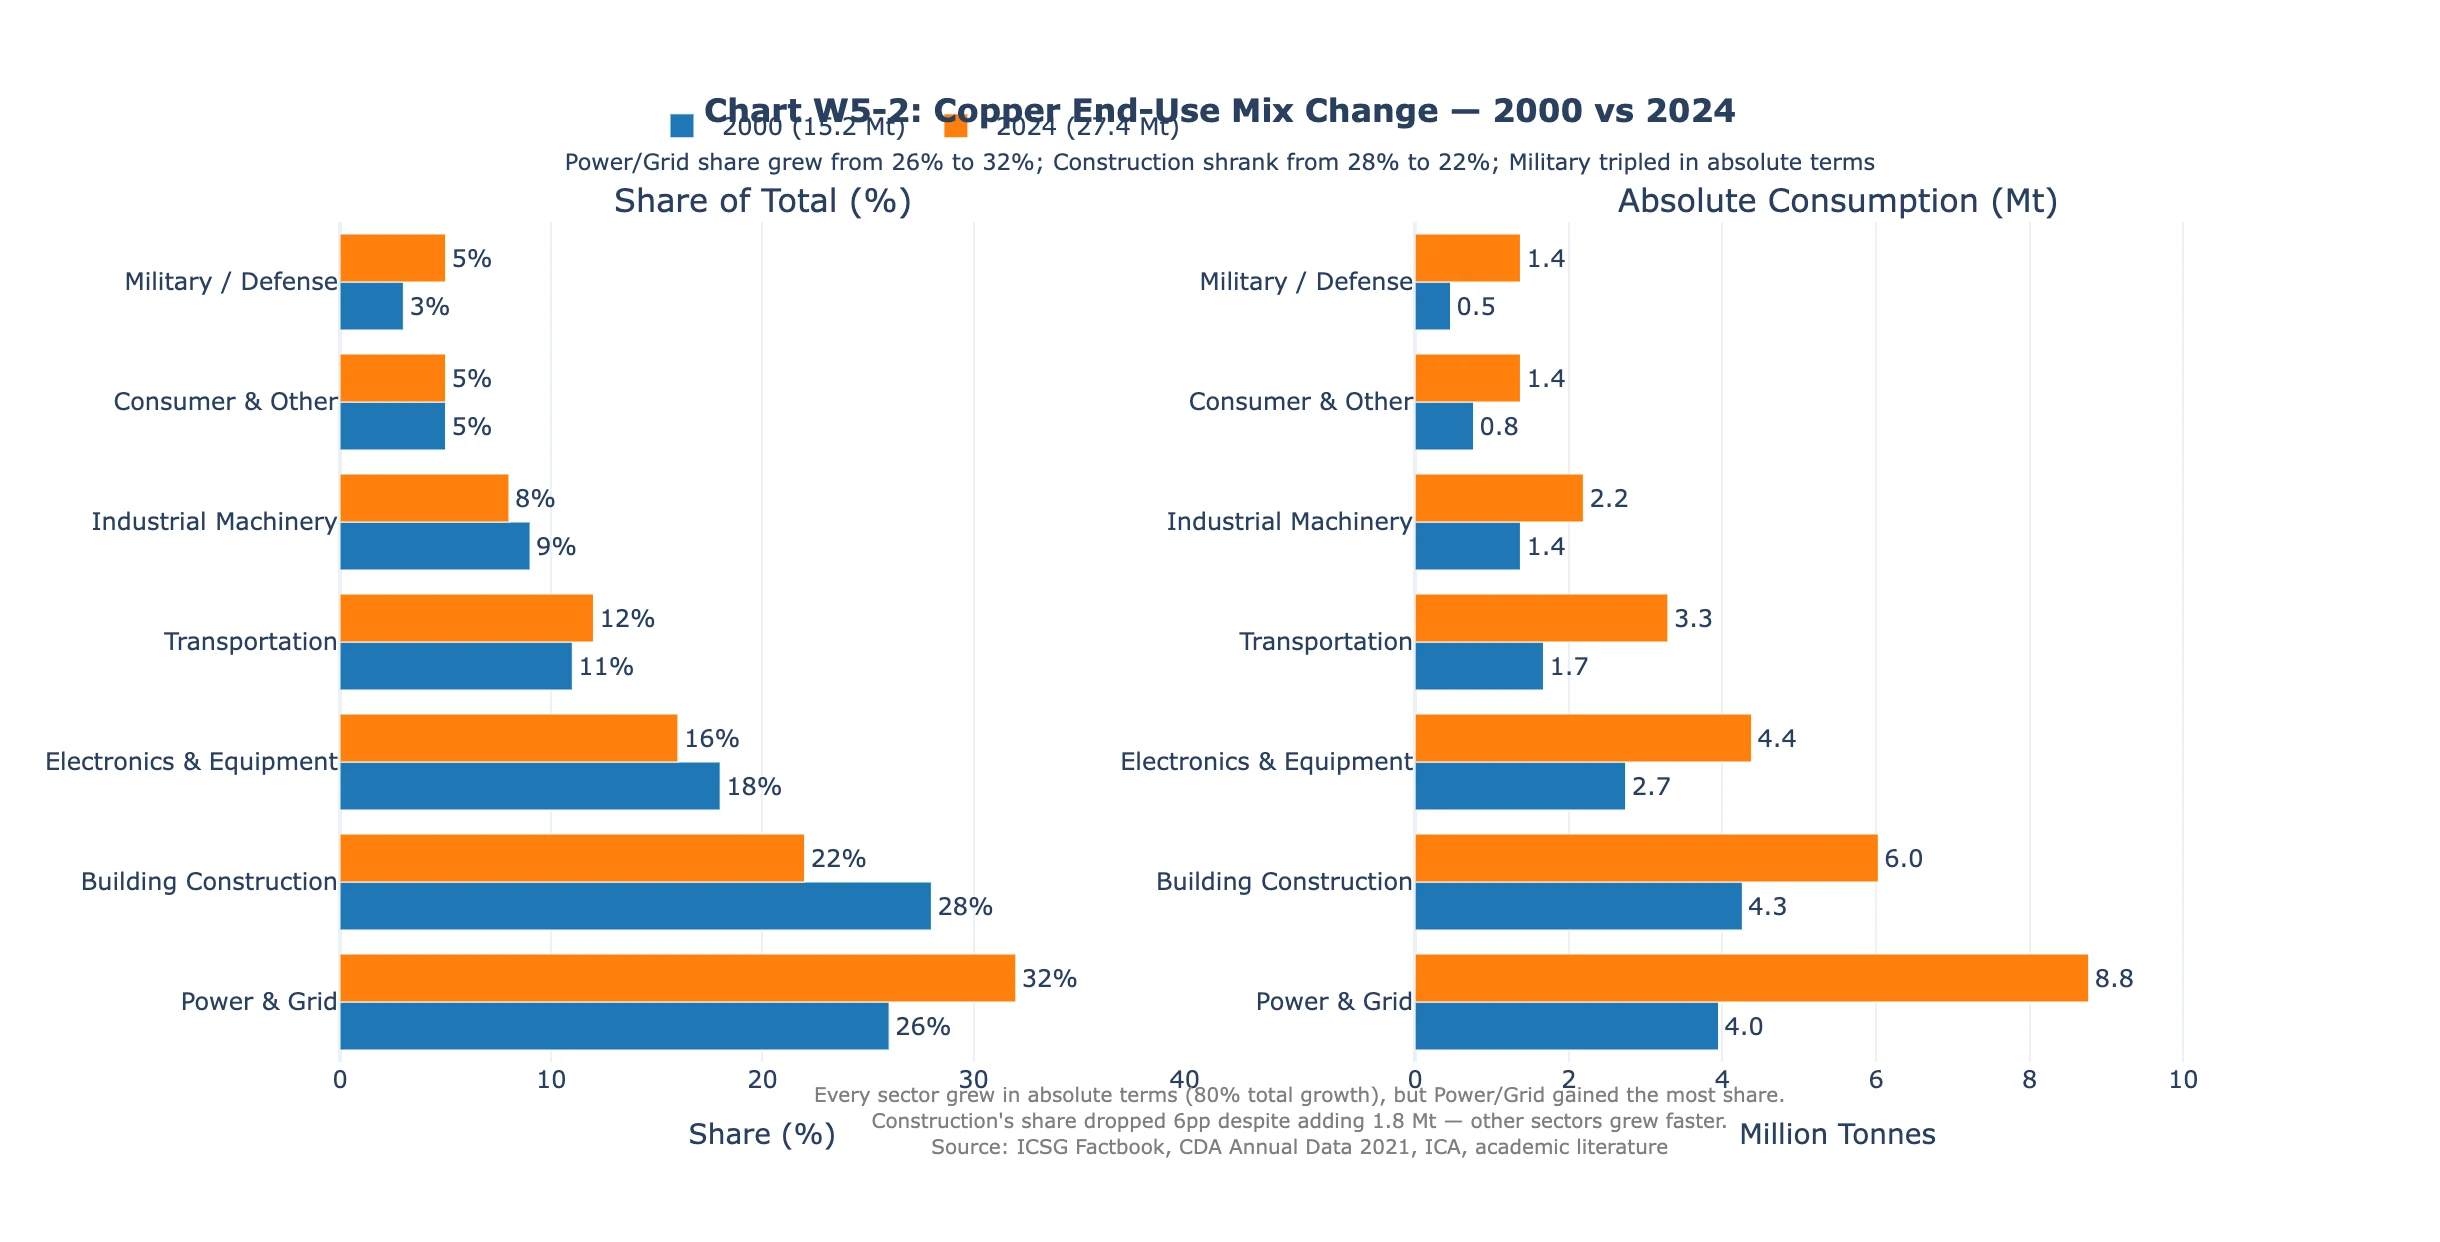
Forty percent of all global copper demand growth came from power grid infrastructure. Data centers currently consume about 0.7% of global copper. EVs account for about 3.1%. Together, they contributed about 11% of demand growth since 2000. The other 89% was power grid, construction, and industrial machinery — dominated by China.
Data centers are a more significant share of US copper consumption — roughly 10.7% — but globally, they’re still a small piece.
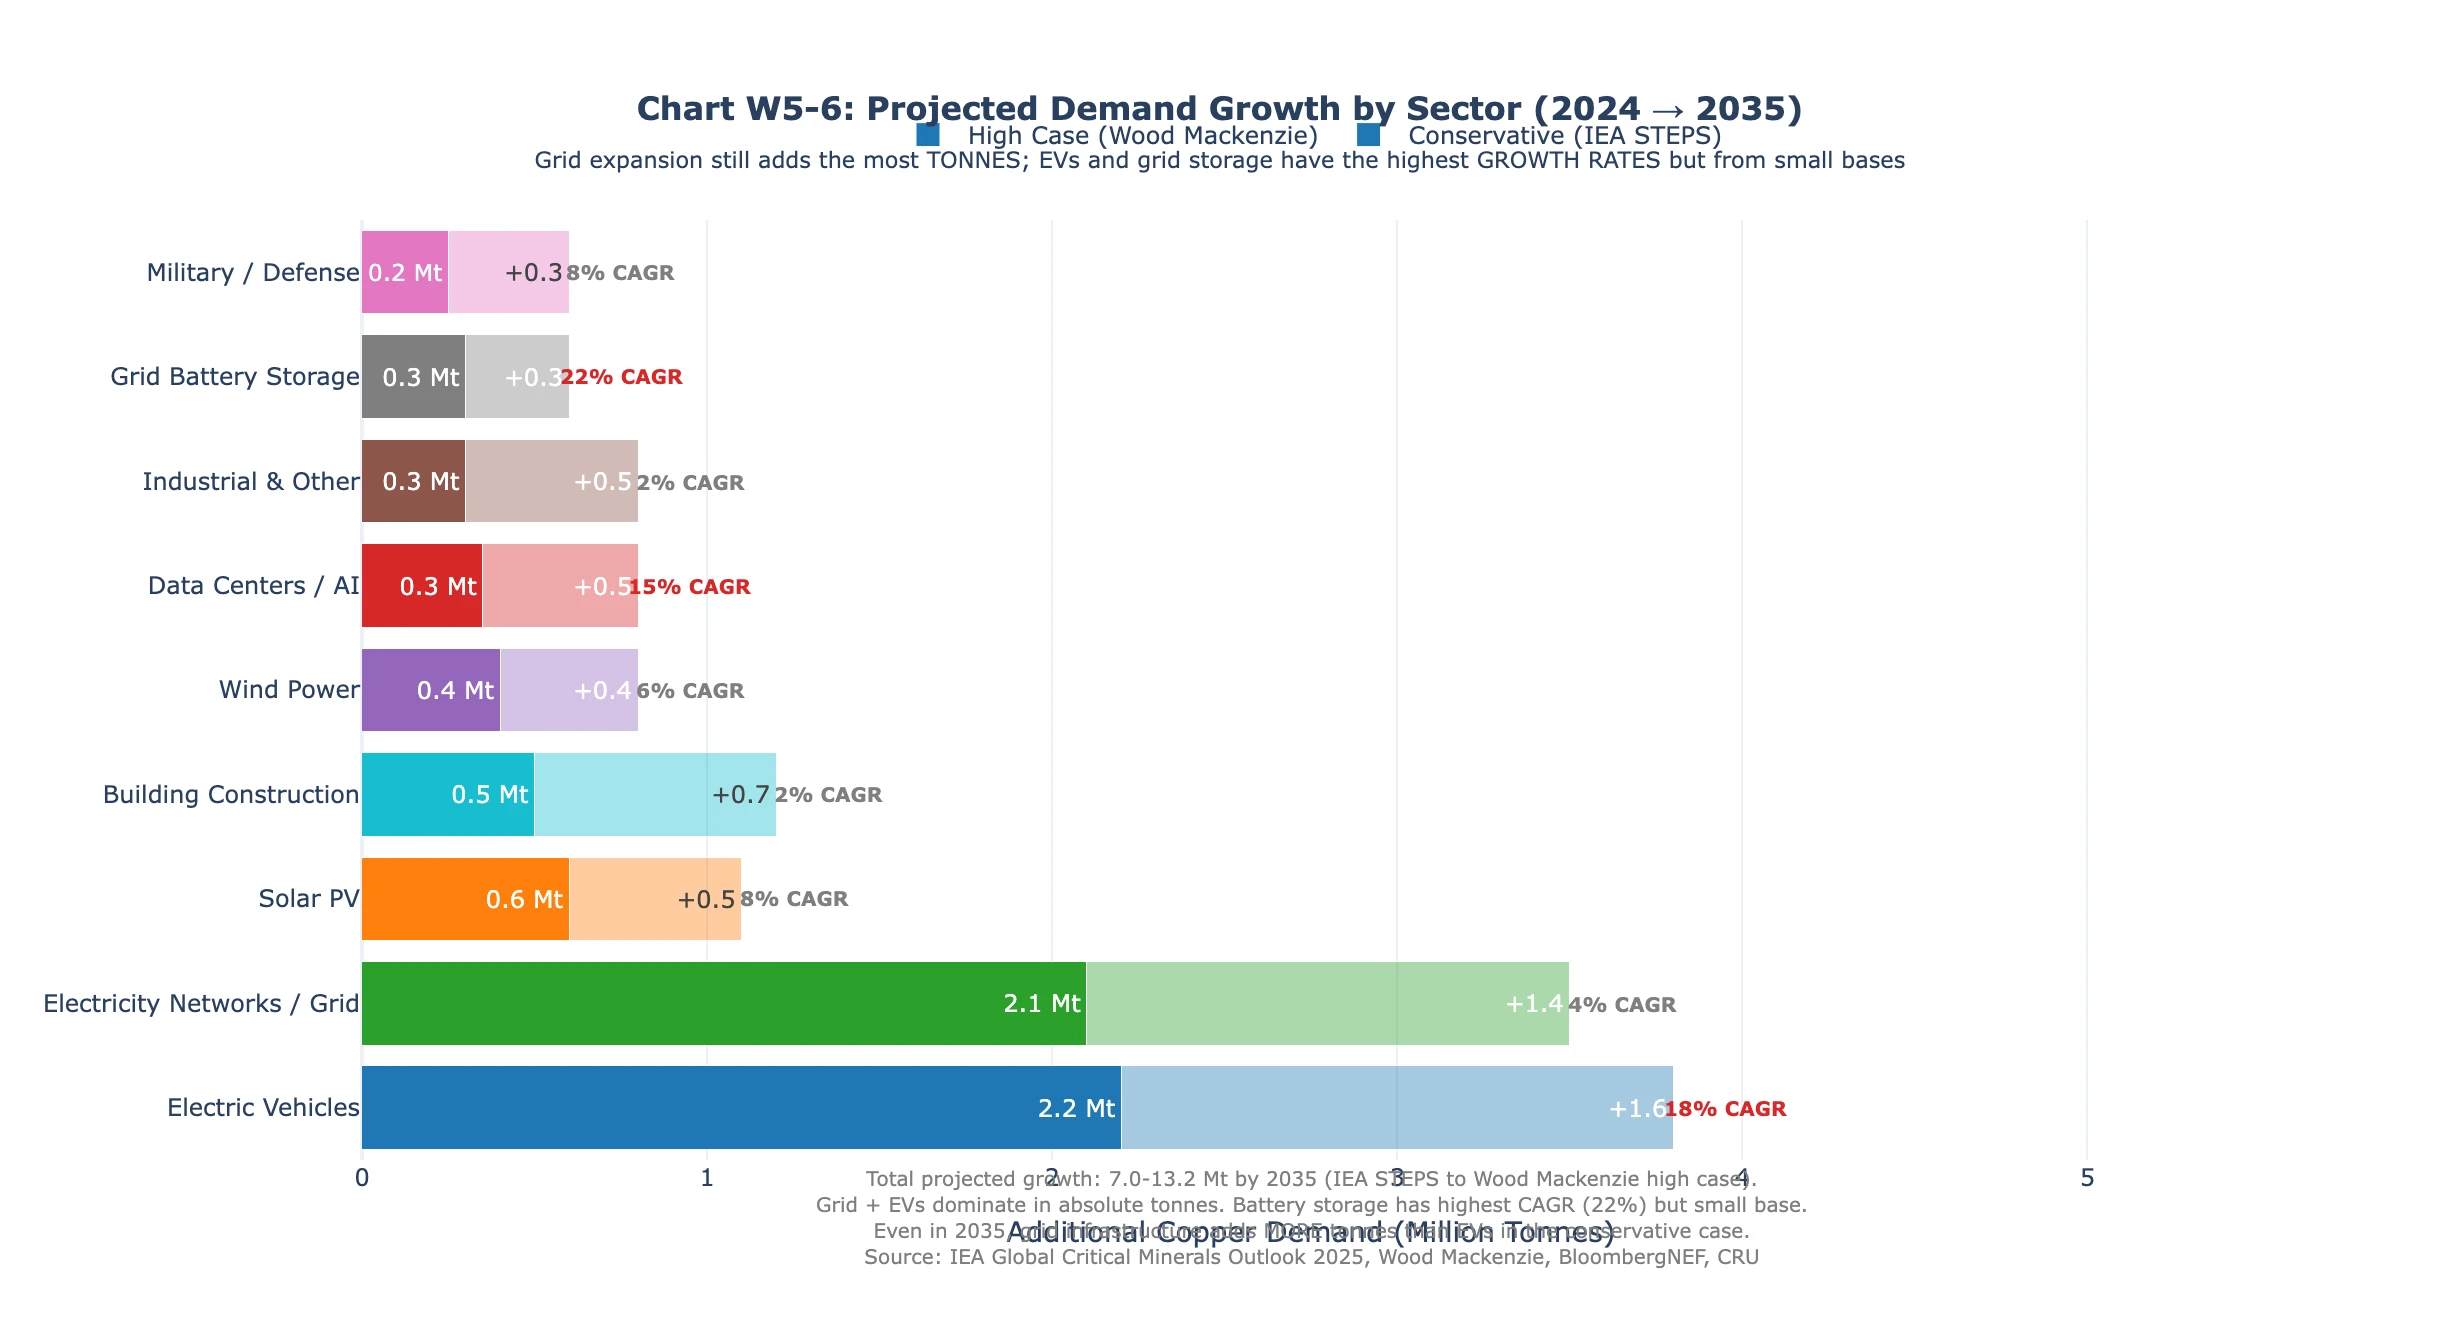
By 2035, the story changes. EVs are projected to add 2.2-3.8 million tonnes of annual demand. Data centers could add 0.5-0.85 million tonnes. At that point, they’ll be major drivers.
But right now, the most accurate thing you can say about copper demand is that China built power grid for 1.4 billion people.
The deficit is coming

Global copper consumption grew 80% from 2000 to 2024. Mine production grew 73%. Every major forecasting institution projects structural deficits within the next few years. ICSG forecasts a deficit of 150,000 tonnes in 2026. S&P Global projects a cumulative 10 million tonne shortfall by 2040. The IEA sees a 30% gap between demand and announced supply projects by 2035.
Every electrified technology uses dramatically more copper than its conventional equivalent. An EV uses 2.8x more copper than an internal combustion vehicle. A heat pump uses 4x more than a gas furnace. Solar generation uses 5x more copper per megawatt than gas. As the economy electrifies, copper intensity per unit of GDP rises rather than falls.
The current copper price isn’t a spike waiting to correct. It’s the result of two decades of structural change in who consumes copper and how expensive it is to produce.
What This Means If You Build Things
So: equipment is expensive because of capacity constraints and manufacturer pricing power. Copper is expensive because China built a grid and ore grades are declining. Neither story is going back to “normal.” What does that mean practically?
The contract gap
Here’s perhaps the most consequential finding in the entire investigation: only 34% of construction contracts include any form of material escalation clause.
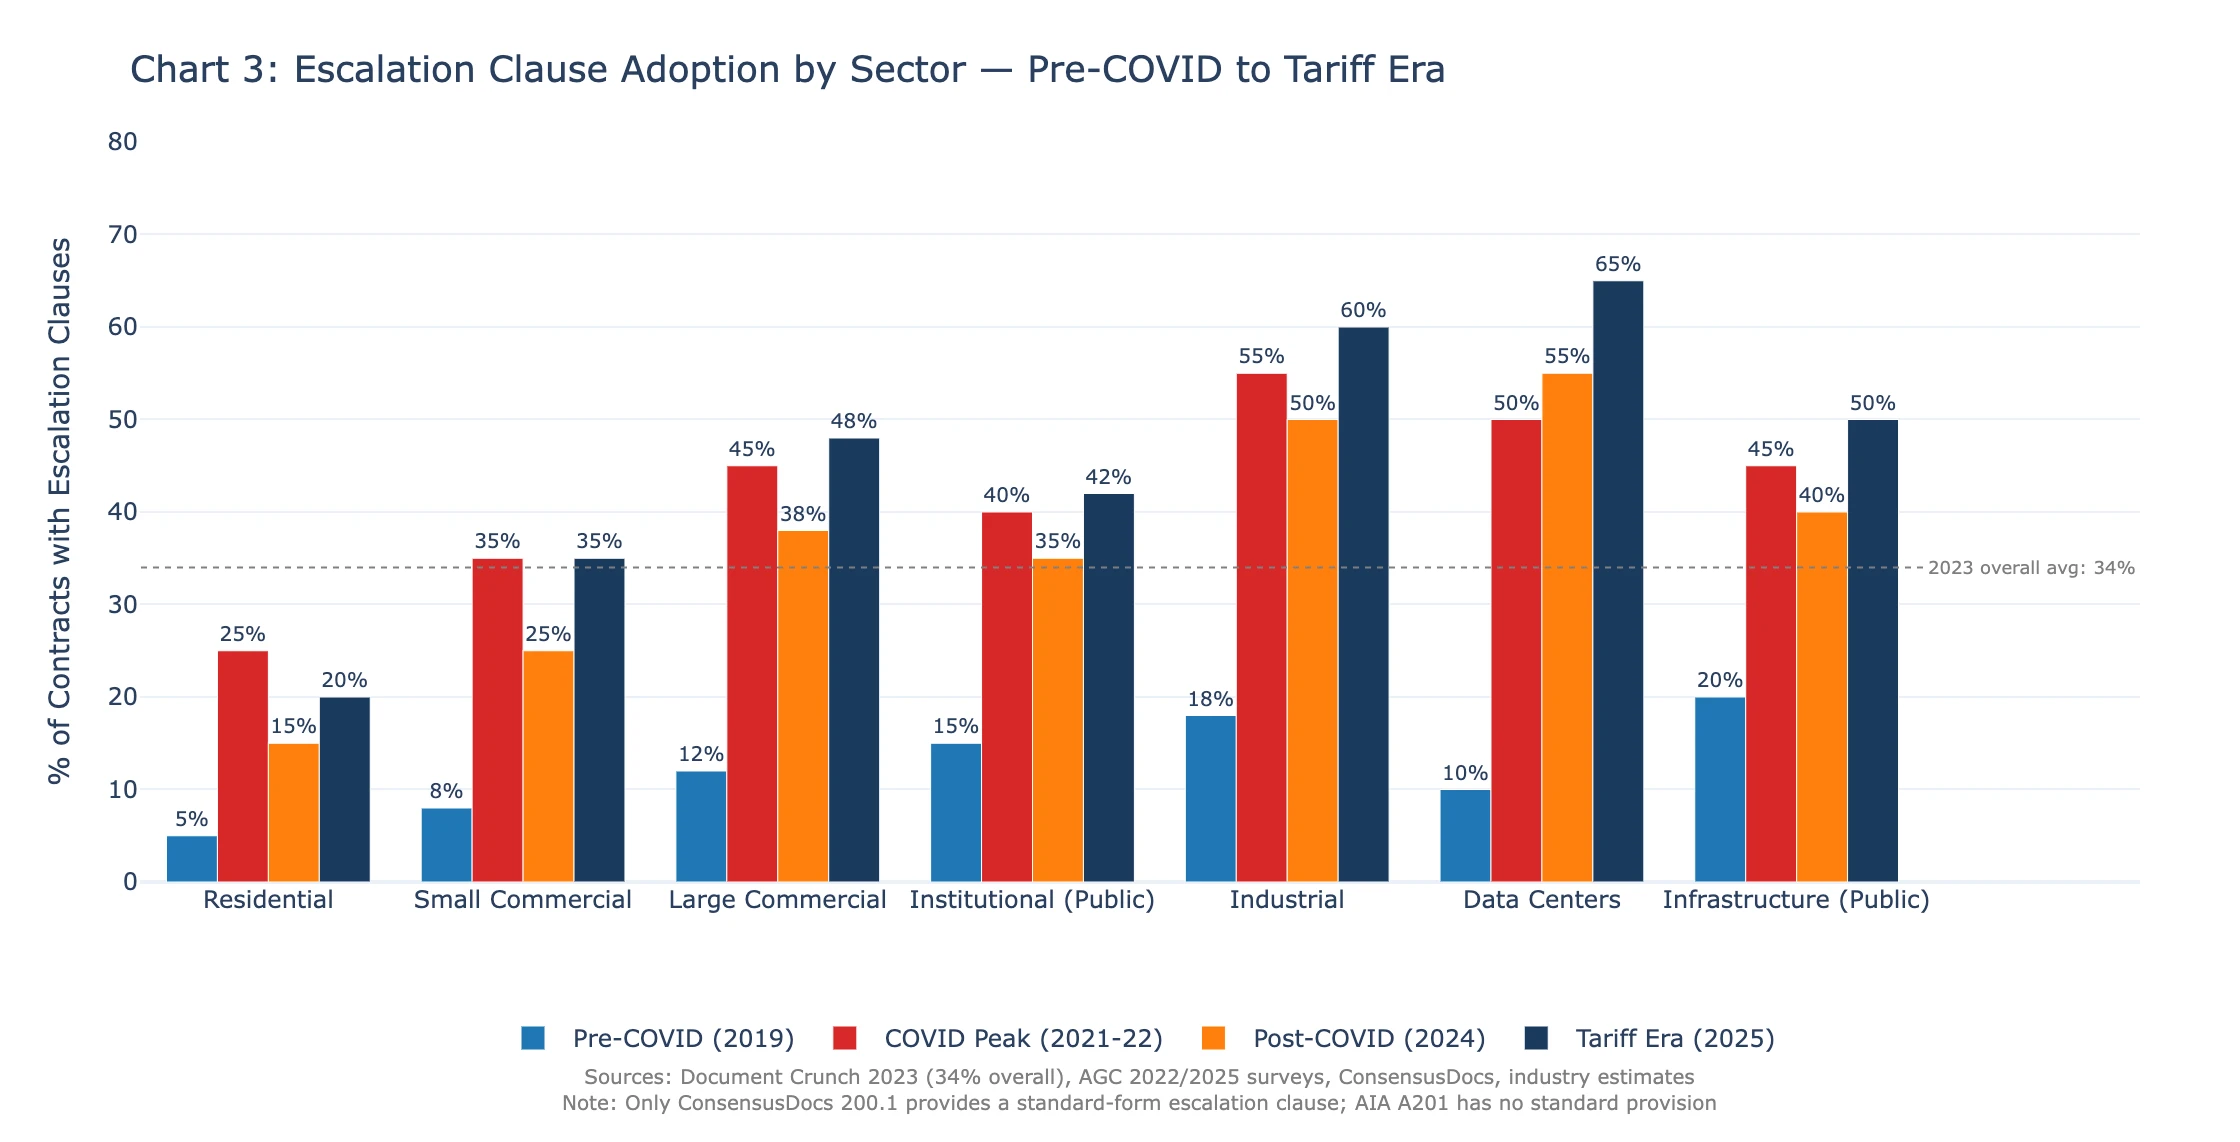
That means on any given project, there’s roughly a two-in-three chance the contractor is carrying 100% of material price risk with zero contractual protection.
The most widely used standard contract forms in US construction — AIA A101, A102, and A201 — contain no standard escalation provision. The industry’s default contract silently places all material price risk on the contractor. You have to know to add escalation language, and you have to have enough leverage to negotiate it in.
| Project Type | Risk Window (Bid to Buy) | Escalation Clause Prevalence |
|---|---|---|
| Small Commercial | 4 months | 5% |
| Mid-Size Commercial | 11 months | 15% |
| Large Institutional | 21 months | 35% |
| Industrial | 26 months | 45% |
| Data Center | 28 months | 60% |
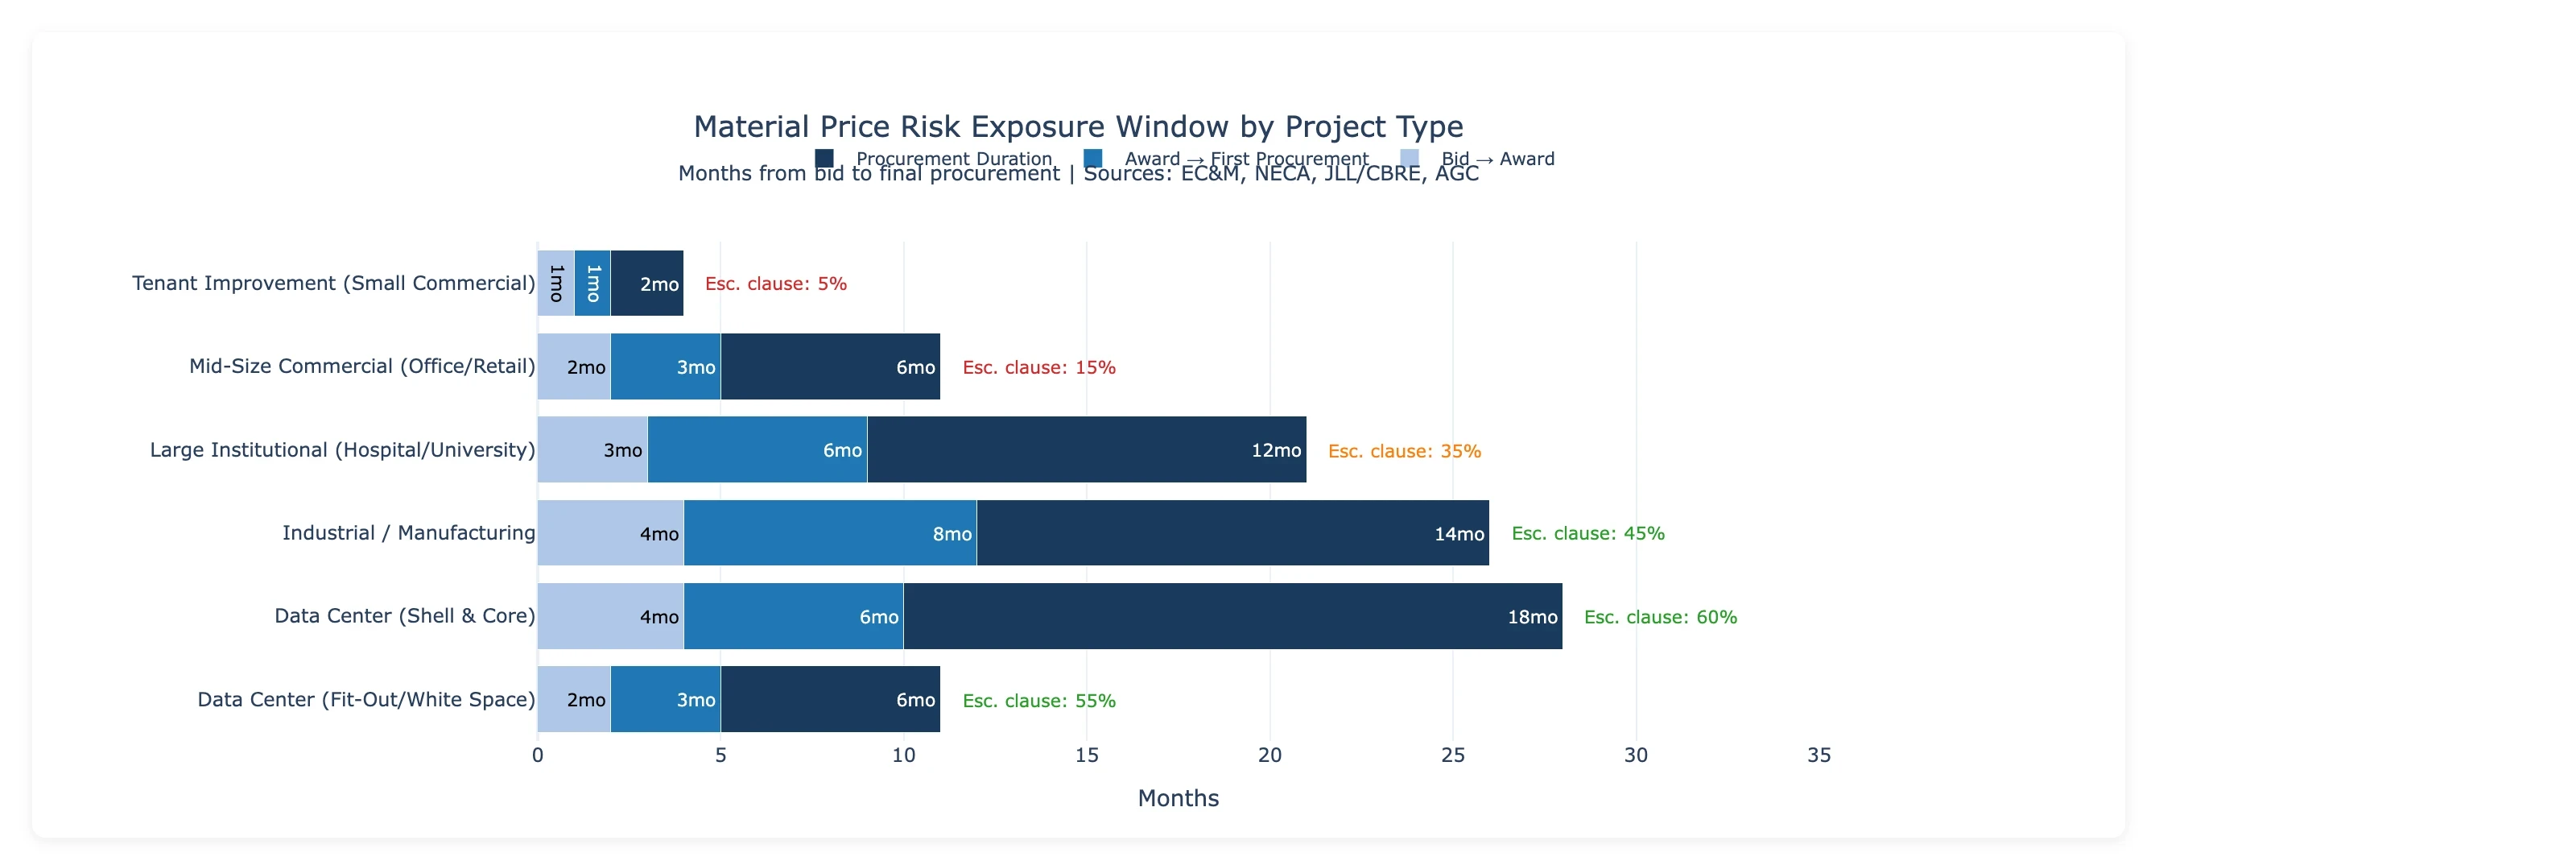
Twenty-eight months on a data center project. That’s 2.3 years between when you set prices and when you actually buy. During 2021-2023, equipment prices rose 25-40% in many such windows.
Equipment lead times extend this further. Power transformers currently have lead times of 128 weeks — about 2.5 years, still 2.6x above pre-COVID norms. For a mid-size commercial project, the transformer lead time can exceed the entire project duration.
The typical electrical contractor earns 6-7% net profit. Run the numbers on what a 50-85% equipment price increase does to a fixed-price contract without escalation protection, and the answer is straightforward: it wipes out the project profit entirely. Construction has the highest first-year failure rate of any major industry — 24% of establishments fail within the first year, versus 20% across all industries — and only about 28% survive a decade, the steepest long-term decline of any sector.
Where This Is Going
Copper prices are likely to stay elevated or rise further. The cost floor keeps rising because ore grades only decline. The supply-demand balance is tightening toward deficit. J.P. Morgan, Goldman Sachs, and the World Bank all forecast copper above $9,000/mt for 2026 — and the current spot price of $12,835/mt has already overshot even J.P. Morgan’s forecast of $12,075/mt, the most bullish of the three. S&P Global projects a cumulative 10 million tonne shortfall by 2040, representing 25% of projected demand.
Equipment prices are unlikely to come down unless manufacturing capacity is meaningfully added. Current utilization at 86% remains well above the threshold where markets self-correct. Some investment is happening — Eaton is investing $1.5 billion in new capacity, Schneider is building three new plants, GE Vernova is doubling transformer capacity — but new factories take years to come online, and demand growth from data centers and grid modernization is at least as large as planned capacity additions.
These two stories reinforce each other. Copper costs feed into equipment bills of materials. Equipment lead times constrain how fast infrastructure gets built. Both push in the same direction: more demand, constrained supply, higher prices. And data centers are creating a compounding loop: they consume massive amounts of electricity — roughly 4.4% of US power today and projected to reach 7-12% by 2028 — which in turn requires grid upgrades (more transformers, more switchgear, more copper), which further tightens supply. The pressure is real enough that on March 4, 2026, the White House announced the “Ratepayer Protection Pledge” — signed by Amazon, Google, Meta, Microsoft, OpenAI, Oracle, and xAI — requiring tech companies to “build, bring, or buy” all new power generation and cover the full cost of grid upgrades for their data centers, so household electricity costs don’t rise.
The structural conditions that drove these increases — capacity shrinkage, China’s grid buildout, declining ore grades, manufacturer pricing power sustained by multi-year backlogs — are not reversing. This appears to be the new baseline, not a temporary departure from it.
Sources
This analysis relies on public data and publicly reported financial information. BOM composition percentages come from DOE transformer rulemaking teardown data and may not reflect every manufacturer’s specific designs. This is investigative research aimed at trying to better understand “What’s going on with copper and electrical equipment prices?”
Primary data sources
- Bureau of Labor Statistics (BLS): Producer Price Index series for electrical equipment, copper wire, steel conduit, transformers, switchgear, panelboards. Industrial production and capacity utilization indices.
- Federal Reserve Economic Data (FRED): Industrial production indices, capacity utilization, manufacturing output.
- US Geological Survey (USGS): Mineral Commodity Summaries 2025/2026, Data Series 140 (historical copper data).
- International Copper Study Group (ICSG): World Copper Factbook 2025, supply/demand balance forecasts.
- CBRE Data Center Solutions: North America Data Center Trends (semi-annual, MW under construction data).
- COMEX/CME Group: Copper futures pricing.
- S&P Global: Copper supply/demand projections, mine cost data.
- IEA: Global Critical Minerals Outlook 2025.
- Wood Mackenzie: T&D Supply Chain reports, transformer and switchgear lead times.
- Department of Energy (DOE): Transformer Rulemaking Technical Support Document (BOM teardown data), Data Center Electricity Demand Report.
- Company SEC Filings: Eaton Corporation, Schneider Electric, ABB, GE Vernova, Freeport-McMoRan, Southern Copper.
Construction industry sources
- NECA: 2024 Profile of the Electrical Contractor, Financial Benchmarker 2024.
- CFMA: 2024 Construction Financial Benchmarker Executive Summary.
- Document Crunch: 2023 construction contract analysis (34% escalation clause finding).
- AIA/ConsensusDocs: Standard contract forms (A101, A102, A201, ConsensusDocs 200.1).
- AGC: Price Escalation surveys (2021-2022).
Institutional forecasts referenced
- J.P. Morgan, Goldman Sachs, World Bank Commodity Markets Outlook, CRU Group, ICSG.
Policy sources
- White House Ratepayer Protection Pledge (March 4, 2026)
- FERC Order on PJM Data Center Colocation (December 18, 2025)